Click to view article in PDF format.
PSLibyan Murzuq Basin Source Rocks*
Peter B. Hall1, Malvin Bjoroy1,2, Ian L. Ferriday1, and Yousef Ismail3
Search and Discovery Article #40616 (2010)
Posted October 29, 2010
*Adapted from poster presentation at AAPG Convention, New Orleans, Louisiana, April 11-14, 2010.
1Fugro Geolab Nor AS, Hornebergveien 5, P.O. Box 5740, N-7437 Trondheim, Norway ([email protected])
2Malvin Geochemistry AS, Ekornveien 37, N-7560 Vikhammer, Norway
3ERG Geological Limited 174, level 17, Tower 1, Al Fatah Tower, Tripoli, Libya
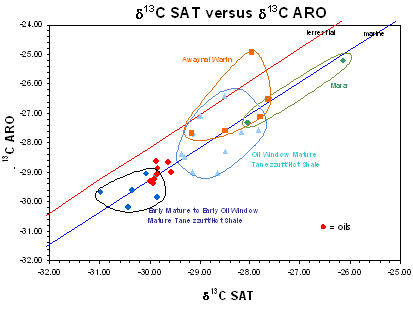
In the Murzuq Basin four potential Palaeozoic source rocks, Marar, Awaynat Wanin, Tanezzuft and Hot Shale formations have been considered. From the standpoint of oil potential the Carboniferous Marar Formation appears to be mainly poor and gas prone, whereas the Devonian Awaynat Wanin has oil potential in parts of the basin. The Silurian Tanezzuft Formation has mostly poor to fair oil potential, while the Silurian Hot Shale has good to rich oil potential.
Several hundred source rock samples and a number of oils from the Murzuq Basin in southwestern Libya have been analysed. All routine organic geochemical techniques were employed in the study, including, saturated and aromatic GC and GC-MS (SIR) and stable carbon isotope analysis.
Towards the northern rim of the basin the depth of the oil window is considerably influenced by uplift and erosion so that the oil window in this area is at depths above 5000 ft. This oil window was probably only effective during the Jurassic-Cretaceous. From the central part of the basin northwards there is an increase in maturity of the Hot Shale from early mature-early oil window mature to condensate window mature. To the south and east there has been less uplift and erosion and the Tanezzuft/Hot Shale sequences are mostly within the oil window.
|
|
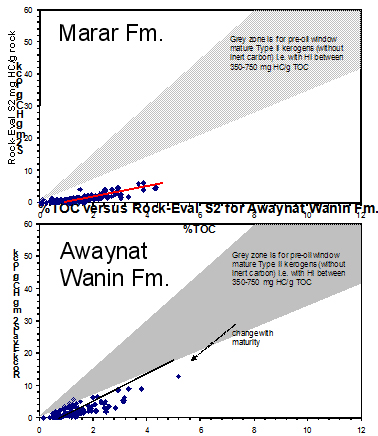
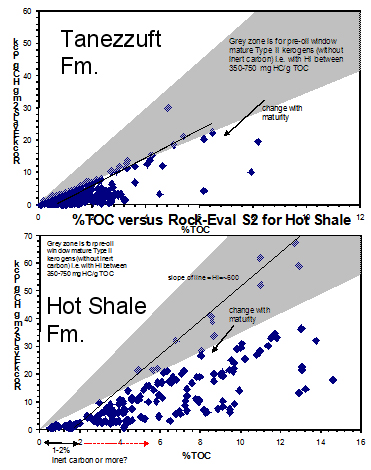
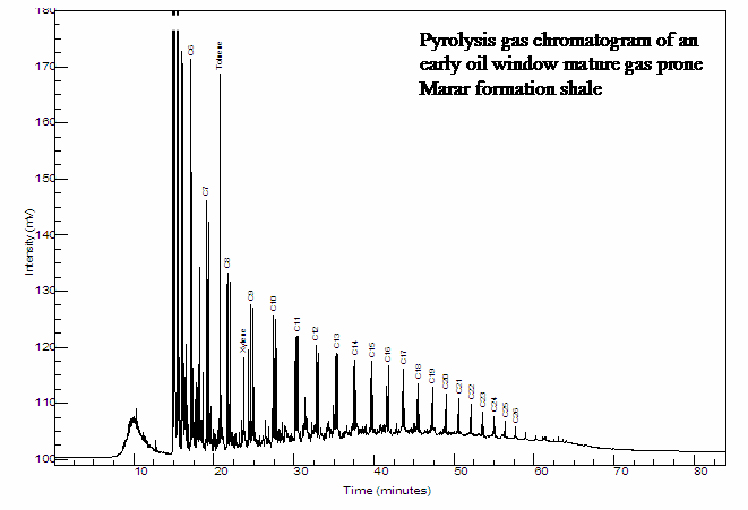
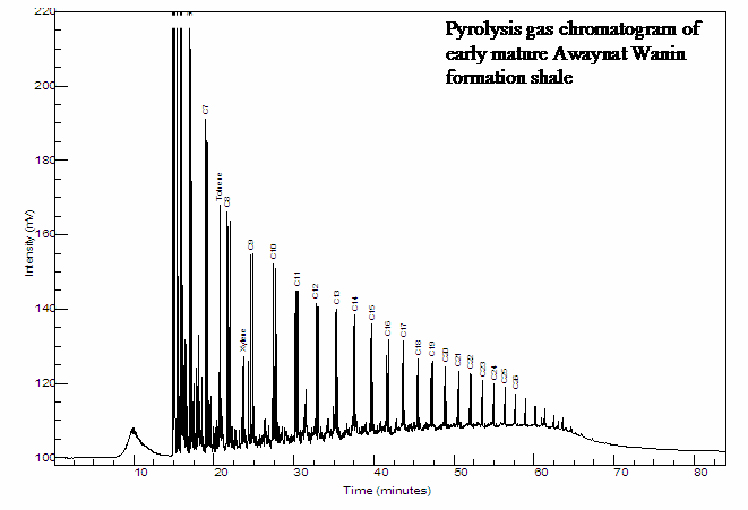
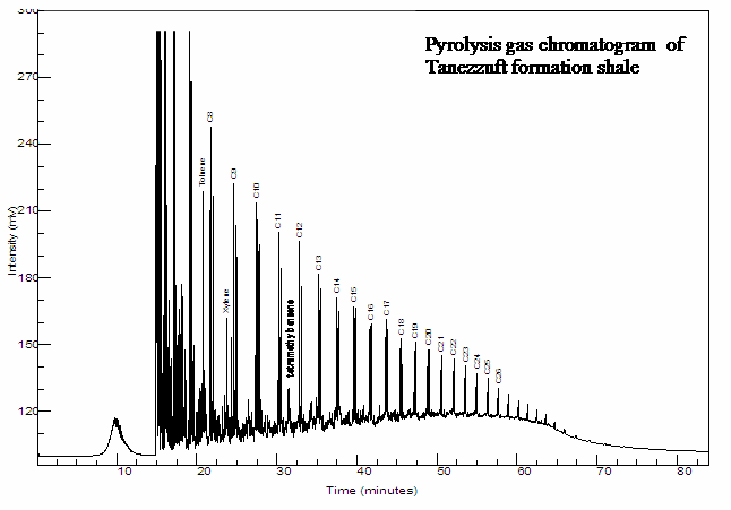
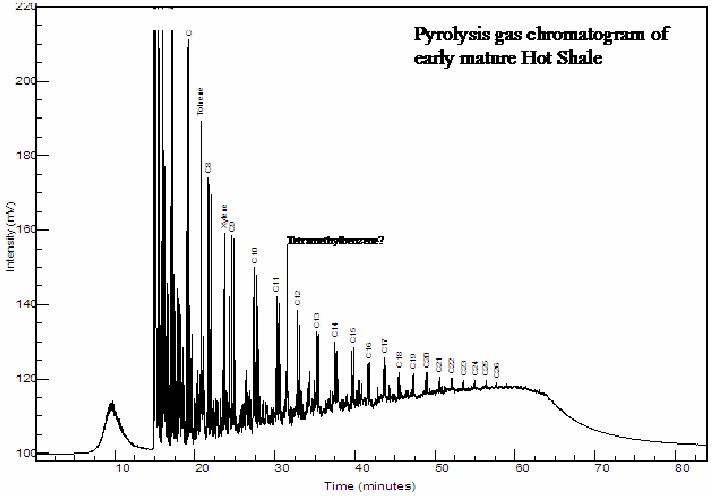
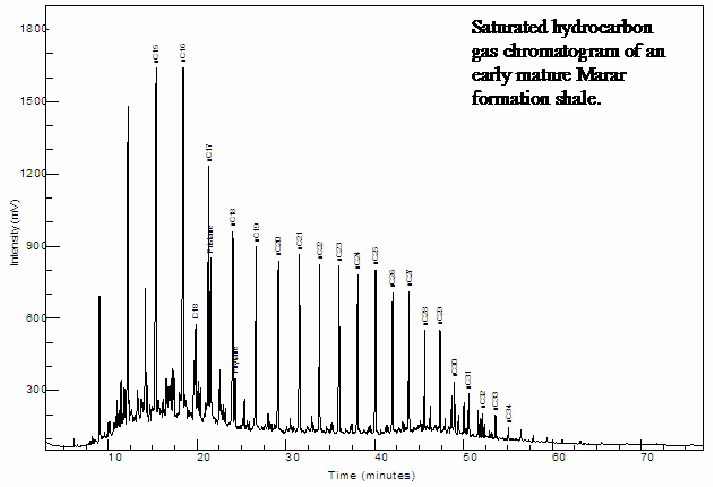
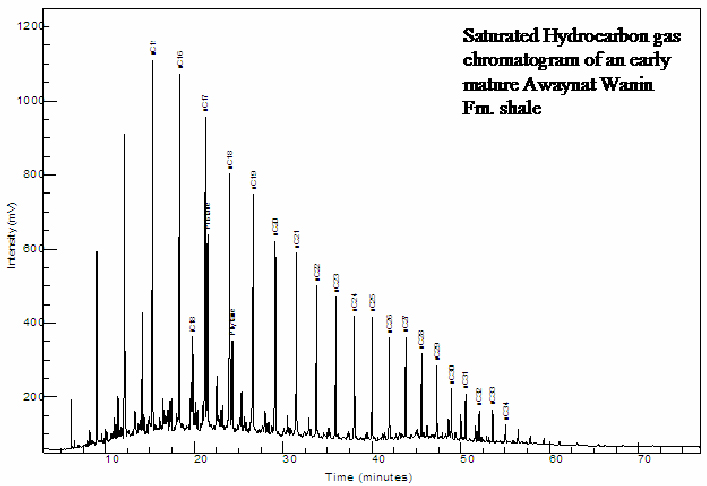
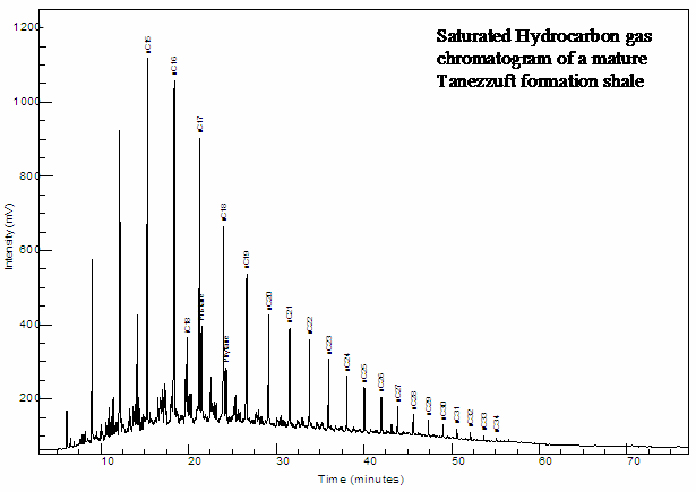
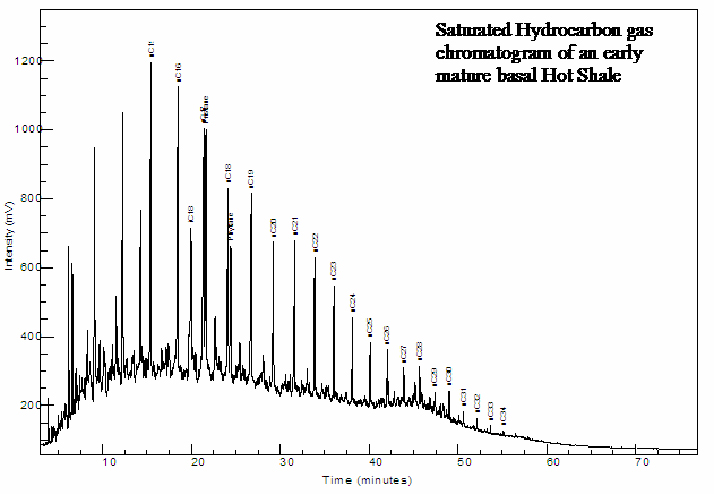
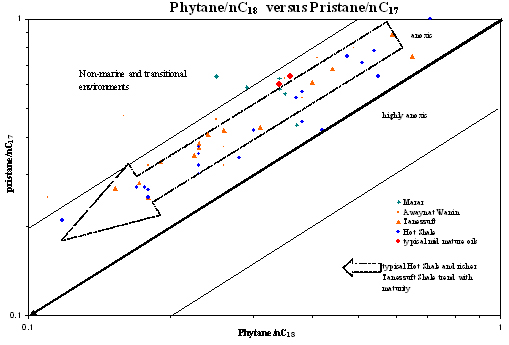
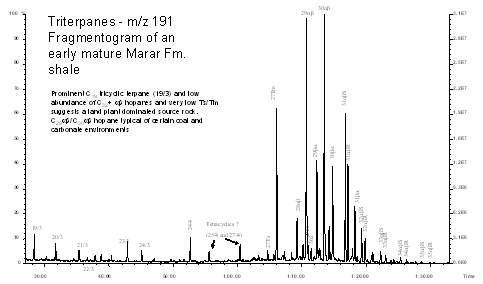
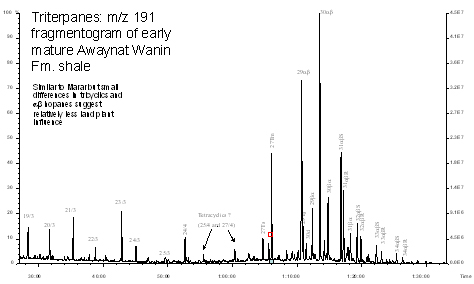
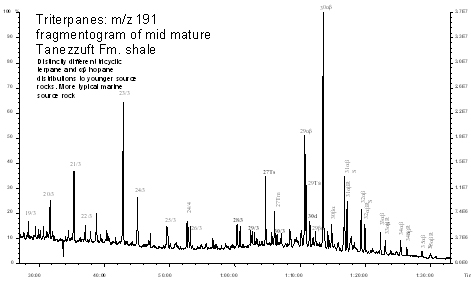
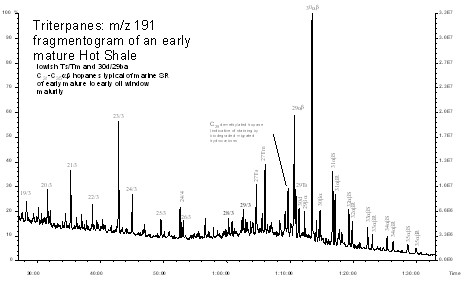
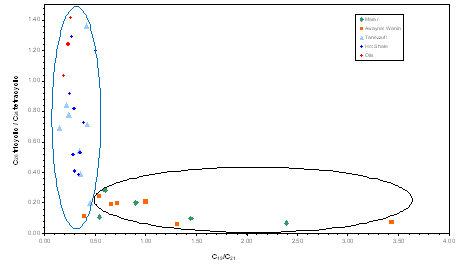
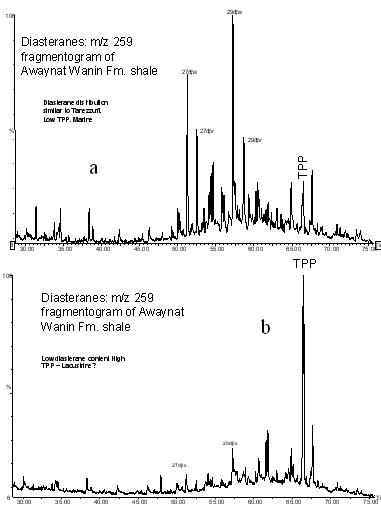
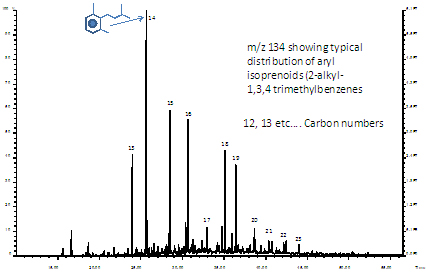
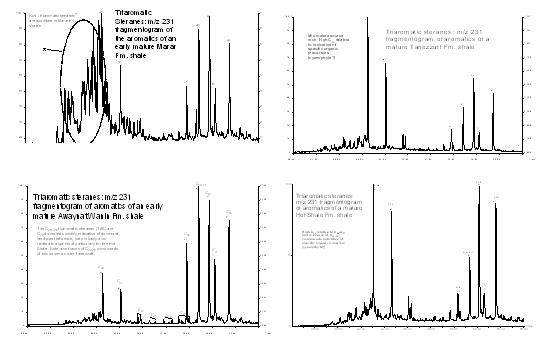
In North Africa, Palaeozoic hydrocarbon systems provide effective plays in most onshore areas, although these are less significant in Egypt. The same depositional system is also developed on the Arabian Peninsula (Lüning et al., 2000). The basis for successful plays are organic-rich clastic source rocks of Silurian and Late Devonian age (Boote et al., 1998; Lüning et al., 2000). Silurian organic-rich shales are estimated to be the origin of 80-90% of all Palaeozoic sourced hydrocarbons in North Africa (Lüning et al., 2000). Hydrocarbons generated from these source rocks migrated into various reservoir horizons, from Cambrian to Triassic sandstones and sealed by shales. In the Murzuq Basin Ordovician sandstones are the main reservoir rocks. The timing of hydrocarbon trap development across North Africa is complex. Multiple re-activation of structures is common and due to this complexity the detailed structural history of many present-day structures is not clear. The petroleum potential of the Palaeozoic basins varies across North Africa, largely due to differences in structural styles and basin type (Lüning et al., 2000). One of the key controls on hydrocarbon prospectivity is the distribution and maturity history of the main Palaeozoic source rocks. The main reservoirs are of Ordovician age. Upper Ordovician reservoirs in North Africa contain several billion barrels of oil equivalent across a broad area from the Murzuq Basin in southwest Libya to the Ahnet Basin in central Algeria. Most of these reservoirs were deposited in glacially-influenced, generally shallow marine settings, on the continental shelf (Lüning et al., 2000). Melting of the Late Ordovician ice cap caused the Early Silurian sea-level to rise by more than 100 m, leading to a major transgression that flooded the North African shelf as far south as the northern parts of Mali, Niger and Chad. Graptolitic shales represent the dominant facies, while deposition of sandstone or non-deposition prevailed on regional palaeo-highs (Lüning et al., 2000). Most of the Silurian Tanezzuft Formation is organically lean, with the exception of two periods of anoxic deposition (Lüning et al., 2000). Isopach and other data for the basal Silurian, organic-rich 'hot shales' in Libya and Algeria suggest that deposition of this important petroleum source rock was restricted to palaeo-topographic depressions (Lüning et al., 2000). Organically rich black shales with total organic carbon values of up to at least 17% were deposited during the period. The kerogen type of the hot shales is regarded as type I or II (Lüning et al., 2000; Hallett, 2002). Large areas of the Murzuq Basin lack the hot shale and seem to have been palaeo-highs during the period of deposition of the anoxic shales. The more continuous and thickest hot shale sections occur in the NC115 and NC174 concession areas (Lüning et al., 2000) in the northern part of the basin. Major oil discoveries are restricted to the north of the central part of the basin. These include seven small, undeveloped oil field discoveries, with total reserves of about 150 million bbl, and one major discovery, the Elephant Field in NC174, with estimated reserves of at least 500 million bbl of oil. The Murzuq oil field complex in A, B, C, H, and J-NC115 fields, with reserves of about 1 billion bbl of oil, is situated further north still. The base of the Tanezzuft Shale is between 2000 to 4000 m in the central part of the basin and since peak-oil is approximately between 2000-3000 m the basal Tanezzuft (hot shale horizon) is at peak-oil to wet-gas generation stages (Rusk, 2001; Hallett, 2002). Expulsion/migration probably occurred from the Jurassic to the end of the Cretaceous, although there may have been some generation during the Carboniferous (Hallett, 2002). The hot shales were probably uplifted out of the hydrocarbon generating window during the Tertiary (Lüning et al., 2000). Based on timing of hydrocarbon generation the Tanezzuft hot shales are probably the only effective oil source of importance in the Murzuq Basin (Hamyouni, 1991). However, it is possible that some low mature oil could have been expelled from Devonian Awaynat Wanin Formation organic-rich shale in the basin centre (Meister et al., 1991). In the north and northwest of the basin over the Gargaf Arch, maturity levels are abnormally high for their present-day depth of burial. Fission track data suggest that area may have been uplifted by as much as 2-3 km during the Hercynian Orogeny and by 1-2 km during the Alpine Orogeny (Craig et al., 2006). Samples and Experimental Procedures A complete set of geochemical analyses were undertaken on the oil and sediment samples supplied by REMSA from over 50 wells were used in this evaluation. Details of the analytical procedures are given. Further details can be found in earlier publications (Bjorøy et al., 1985, 1992) Total Organic Carbon (TOC) analysis is performed on samples after treatment with 10% hydrochloric acid to using a LECO (S244 Carbon Analyser). Rock-Eval Pyrolysis was performed using a Rock-Eval 6 Pyrolyser. Thermal Extraction-Pyrolysis Gas Chromatography is performed on a Geofina Hydrocarbon Meter (GHM), (Bjorøy et al., 1985, 1992). Solvent Extraction of Organic Matter (EOM) is performed using a Tecator Soxtec HT-System with dichloromethane as solvent. The amount of EOM is gravimetrically established. Asphaltenes are removed from the EOM by precipitation in n-pentane. Chromatographic Separation of Deasphaltened EOM Chromatographic separation is performed using an MPLC system (developed at Geolab Nor AS) using hexane as an eluant. The saturated and aromatic hydrocarbon fractions are collected and reduced to low bulk using a rotary evaporator at 30°C. Gas Chromatographic Analyses: Saturated hydrocarbon fractions were performed on a Varian 3400 gas chromatograph equipped with an FID detector and an OV1 column. The carrier gas is helium and the temperature program runs from 80°C to 300°C at a rate of 4°C/min. Final hold time is 20 minutes. Aromatic hydrocarbon fractions were analysed on a Varian 3400 gas chromatograph with a 25 m SE 54 capillary column, split injector and a column splitter leading to FID and FPD detectors which allows simultaneous analysis of hydrocarbons and sulphur compounds. The carrier gas is helium and the temperature program runs from 40°C to 290°C at a rate of 4°C/min. Final hold time is 10 minutes. Whole oil gas chromatography is performed on a Perkin Elmer Sigma 2000 gas chromatograph fitted with a split injector, 25 m SE54 capillary column and effluent splitter connected to FID and FPD detectors allowing simultaneous determination of hydrocarbons and sulphur compounds. Combined Gas Chromatography - Mass Spectrometry (GC-MS) was performed on an Autospec system interfaced to a Hewlett Packard 5890 gas chromatograph. The GC is fitted with a fused silica SE54 capillary column (40 m x 0.22 mm i.d.) directly into the ion source. Helium (12 psi) is used as carrier gas. The GC oven is programmed from 45° C to 150° C at 35°C/min, and from 150°C to 310°C at 2°C/min and isothermal for another 15 min. For the aromatic hydrocarbons, the GC oven is programmed from 50°C to 310°C at 5°C/min. and held isothermally at 310°C for 15 min. The mass spectrometer is operated in electron impact (EI) mode at 70 eV electron energy, a trap current of 500 µA and a source temperature of 220oC. The instrument resolution used is 1500 (10 % value). The samples are analysed in multiple ion detection mode (MID) at a scan cycle time of approximately 1.1 sec. Stable Carbon Isotope Ratio Mass Spectrometry Carbon isotope analysis is performed on a dual inlet VG SIRA 10 instrument. The isotope ratios are given as δ values in ‰ versus the PDB-standard: δ13C = (R sample - R standard/R standard) x 1000 where R=13C/12C. Vitrinite Reflectance measurements are made under oil immersion at 546 nm. Visual Kerogen Microscopy Kerogen concentrates are obtained from samples prepared by HCl and HF digestion followed by zinc bromide flotation to remove pyrite and other heavy mineral residues. Slides were analysed microscopically in transmitted white light and UV light (530 nm barrier filter) to determine the Spore Colour Index (SCI) and the colour and intensity of spore fluorescence. Source Rocks Richness and Type The Marar Formation (Figure 1a) has the least source rock potential and the Hot Shale the most. The former has generally poor to fair gas potential (less than 4% TOC and S2 less than 6 mg HC/g rock. However, it is possible that the Marar Formation improves towards the southeast. The shales in the Marar Formation have mainly kerogen type III or IV with the best samples having rich TOC contents and in rare cases type II/III kerogen (HI> 200 < 300 mg HC/g TOC). The Marar is regarded as an inner shelf marine deposit (Whitbread et al., 1982) and kerogen composition indicate a land plant-dominated source rock (mostly woody and herbaceous kerogen). The Awaynat Wanin Formation (Figure 1b) has a similar potential to the Marar Formation, although in some parts it has a fair to good oil potential. The Devonian shales are, like the Marar Formation shales, generally gas prone, but with overall slightly better potential than the Marar. However, in certain areas the Awaynat Wanin Formation shales have fair to good oil potential based on Rock-Eval data. Screening data show the shales have up to almost 6% TOC and 15 mg HC/g rock for S2 and hence type contain kerogen type II/III grading to type II kerogen. The visual kerogen composition of the Awaynat Wanin Formation samples appears to be fairly similar to the Marar Formation, in that higher plant debris is abundant, but with slightly more algal remains, notably acritarchs. This formation is regarded as ranging in depositional environments from marine to fluvial. The Tanezzuft Formation shales (Figure 1c) have mostly less than 3% TOC and less than 10 mg HC/g rock of S2 and type III or II/III kerogen with the better quality kerogen often, but not always, at the base of the formation. The vast majority of shales however have less than 1% TOC so that the shales generally have poor-fair potential for gas and minor oil. However, in some areas there are thin horizons where shales are good oil prone source rocks, although not nearly as prolific as the basal Hot Shales (which is defined by gamma-ray log response, Luning, 2000). The difference in kerogen composition of the Tanezzuft Formation and the Hot Shale Formation appear to be mainly in quantity rather than composition. The Hot Shale Formation (Figure 1d) has the greatest potential with % TOC from 2% up to at least 15% (probably up to 20%) and with S2 up to at least 60 mg HC/g rock and probably higher values. However, only a few samples were found with hydrogen indices greater than 400 mg HC/g TOC. In most of the rest of the richer samples HI is less than 400 due mainly to the thermal degradation of the kerogen. Based on the HI values and level of maturity, some of the Hot Shale may be of poorer quality (i.e. possibly type II/III rather than II). The Tanezzuft and Hot Shale formations are regarded as being deposited in marine inner shelf environments, similar to the Devonian samples. Kerogens Most of the pyrolysates of the Marar Formation consist predominantly of C1-C10 products and only in a few cases did samples show products up to at least C30 shown in Figure 3a. The Awaynat Wanin Formation shales have a similar pyrolysis gas chromatographic pattern (Figure 3b) to that shown in Figure 3a indicating a similar kerogen composition. However, in other areas the pyrolysis gas chromatograms of the formation show a greater range of hydrocarbons and more pronounced UCM than in the Marar Formation indicating some light oil potential (e.g. Figure 3b). These characteristics are even more marked for the Tanezzuft and Hot Shale formations (Figure 3c and Figure 3d). The pyrolysate compositions of the Hot Shale samples also have a distinctly shorter range of alkene/n-alkane doublets indicating predominance of algal/microbial precursors for the kerogen. Visual kerogen compositions of the Tanezzuft and Hot Shale formations, even in organic-poor samples are characterized by abundant acritarchs and also the occurrence of chitinozoans, which are absent or at least not evident in the younger source rocks. They also have in some samples a prominent peak tentatively assigned to be a tetramethylbenzene (not naphthalene which has a slightly longer retention time). This compound has been recorded in pyrolysis gas chromatograms of Palaeozoic source rocks in North America and has been correlated with the occurrence of diaromatic carotenoids derived from photosynthetic sulphur bacteria (Requejo et al., 1992). Furthermore, GC-MS analysis of aromatic hydrocarbon fractions indicates the presence of aryl isoprenoids, which are also products of the same bacterial family are common compounds in the basal hot shales. Gas Chromatography The Awaynat Wanin Formation (Figure 4b) has slightly lower pristane/phytane values in the more oil prone shales (2-3), and slightly less C25+ n-alkanes. The depositional environment was probably similar to the Marar Formation shales, but with less higher plant input. The hydrocarbon compositions of the Tanezzuft/Hot Shale formations are different to the younger formations in that they have more front-end biased n-alkane distributions (Figures 4c-d). However, the shales still have relatively high pristane/phytane values ranging from 1.8 to 2.2, suggesting relatively mild anoxic conditions. Figure 5 shows a crossplot of phytane/nC18 versus pristane/nC17 for the four different source rocks and some selected oil samples. The plot suggests that depositional environments ranges from anoxic to mildly anoxic conditions in most analysed source rocks. The main observed differences in the aromatic hydrocarbon fraction gas chromatograms for the source rocks are due to maturity rather than source. The main difference is that the Marar and Awaynat Wanin formation samples have relatively less alkyl naphthalenes and more polycyclic compounds than the Tanezzuft/Basal Hot Shale samples. This is most probably due to the higher maturity of the latter and also because the kerogens were more algal with much less (or no) land plant input. Saturated Hydrocarbon Biomarkers(Figure 6, Figure 7, and Figure 8) Hopanes Mature Awaynat Wanin Formation shales are also characterized by abundant diahopanes (Figure 6b) and an early eluting hopane series, with shorter retention times than the αβ hopanes. The series is common in certain depositional environments, notably in combination with diahopanes (Farrimond and Telnaes, 1996). Even in low maturity samples the early eluting hopane is present. In the Tanezzuft/Hot Shale triterpanes (Figure 6c and Figure 6d) C33+ αβ hopanes are more abundant and the tricyclic terpane (cheilanthanes) compositions show marked differences to those of the younger source rocks. The C19 tricyclic terpane in particular is relatively less abundant than in the younger formations, while the C28+ tricyclic terpanes (C28 to C30 definitely and higher molecular weight compounds in lesser amounts, probably to at least C36, made more prominent at high maturities) are prominent in the Tanezzuft/Hot Shale, but not in younger formations (although this might be partly due to the lower maturity of the Devonian and Carboniferous source rocks. Tricyclic terpanes from C19-36 are abundant in high palaeo-latitude Tasmanite-rich source rocks, but can also be derived from other algal/bacterial sources (Peters et al., 2005). Clear separation between the Tanezzuft and Hot Shale formations and the other source rocks can be derived from tricyclic terpane or tricyclic tetracyclic terpane ratios such as the C19/C21 tricyclic and C26 tricyclic to C24 tetracyclic ratios. These show good separations between the Silurian shales and the younger source rocks (Figure 7). However, the separation is considered to be reduced by the effects of staining by migrated hydrocarbons and by higher maturity of the younger source rocks. Steranes The higher C29 sterane abundances for the Carboniferous samples are taken to be due to their having a substantial land plant input. However, the distribution is not very different for the Silurian samples, where land plant input might be expected to be low. In the case of the Silurian samples the high C29 abundance is most probably due to specific algal/bacterial species (e.g. cyanophytes blue-green algae). The m/z 259 fragmentograms generally show dominance of the C29 diasteranes, with a slight relative increase in C27 diasteranes components going from Carboniferous to Silurian. For the Awaynat Wanin Formation another organic facies appears to be present in some areas, indicated by the presence of abundant tetracyclic polyprenoids (TPP), which are regarded as indicators of freshwater lacustrine environments (Holba et al., 2003). The difference between the two facies is illustrated by the m/z 259 fragmentograms shown in Figure 8a-b. These compounds have also been found in some near shore marine environments and may represent either an allochthonous contribution from freshwater lacustrine deposits or the algae responsible for the TPP are not restricted to purely freshwater environments (Holba et al., 2003). Aromatic Hydrocarbons All of the source rock samples have triaromatic steranes, where the C28 compounds are the dominant compounds (Figure 10). This preference for C28 compounds has been seen in carbonates as well as land plant-rich deposits. Since there are no indications of a carbonate source and while in the Devonian and Carboniferous land plant organic matter may be responsible for the high C28 abundance, it seems more likely that a specific microbial source is responsible for the high abundance in the Silurian samples. Isotopes Source Rock Maturity, Hydrocarbon Generation and Migrated Hydrocarbons The oil window interval becomes shallower towards the north because of extensive uplift and erosion, but may also be more mature than can be accounted for than just erosion (higher heat flows). Interestingly, the organic carbon content of the Hot Shale samples is still very high (>10%) in some of the most mature sections while the S2 content is relatively low (less than 20 mg HC/g rock). This suggests that a large proportion of the carbon remaining is inert carbon. Assuming that the kerogens did not originally contain abundant inert kerogen, the high content may be due to the thermal history of this area, where there have been several episodes of burial, consequent maturity increase and then erosion. Where kerogen has been subjected to high enough temperatures, major oil generation and expulsion will have occurred, during uplift generation and expulsion will have been stopped. The remaining generated bitumen still in the source rock is not fully expelled on reburial. Migrated Hydrocarbons Besides the Hot Shales, the Devonian Awaynat Wanin Formation is a significant oil prone source rock in parts of the basin, but may not be an effective source rock based on the maturity level. The Marar Formation is neither mature enough nor oil prone. The Hot Shale is by far the dominant effective oil source rock, although there are parts of the Tanezzuft Formation with good potential. Source characteristics of the Awaynat Wanin vary from marine to possibly non-marine (or with a significant allochthonous input from a lacustrine source). The Marar Formation kerogen possibly shows a change to better quality kerogen to the southeast (with more herbaceous remains) and is dominantly composed of land plant remains. The richer hot shale samples tend to have a restricted n-alkane range in which C1-C20 compounds dominate and where pristane/phytane ratios are approximately 2 suggesting relatively mild anoxic conditions, while the presence of abundant aryl isoprenoids suggests that deposition occurred where there was a stratified water column. Tricyclic terpanes (cheilanthanes) from C19 and probably to at least C36 (but with low C19 content) are also significant components of the Hot Shales. These compounds are abundant in high palaeolatitude Tasmanite-rich source rocks but can also be derived from other algal/bacterial sources. The quality of the Hot Shale varies considerably and in some areas has probably up to almost 20% TOC and estimated original HI of at least 600 mg HC/g TOC with S2 probably originally up to 100 mg HC/g rock. Hot Shales are mid to late oil window mature in the deeper central part of the basin and appear to reach similar maturities at shallower depths on the northern uplifted rim of the basin due to erosion and probably also higher heat flows. We wish to thank REMSA for permission to publish this paper. The interpretations presented in this paper represent views of the authors and are not necessarily the official view of REMSA. Bjorøy, M., K. Hall, P.B. Hall, and P. Leplat, 1992, Detailed Hydrocarbon Analyser for well-site and laboratory use: Marine Petroleum Geology, v. 9, p. 648-665. Bjorøy, M., H. Solli, K. Hall, P. Leplat, 1985, Analysis of source rocks, reservoir rocks and cap rocks by combined thermal extraction and pyrolysis-gas chromatography, in B.M. Thomas, et al. (eds.) Petroleum Geochemistry in Exploration of the Norwegian Shelf, Graham & Trotman, London, p. 327-337. Boote, D.R.D., D.D. Clark-Lowes, and M.W. Traut, 1998, Palaeozoic petroleum systems of North Africa, in D.S. MacGregor, R.J.T. Moody, and D.D. Clark-Lowes, eds., Petroleum geology of North Africa: Geological Society of London, p. 7-68. Farrimond, P. and N. Telnaes, 1996, Three series of rearranged hopanes in Toarcian sediments (northern Italy): Organic Geochemistry, v. 25/3-4, p. 165-177. Hallett, D., 2002, Petroleum Geology of Libya: Elsevier, 508 p. Hamyouni, E.A., 1991, Petroleum source rock evaluation and timing of hydrocarbon generation, Murzuk Basin, Libya: A case study, in M.J. Salem and M.N. Belaid, eds., Geology of Libya, p. 183–211. Holba, A.G., L.I.P. Dzou, G.D. Wood, L. Ellis, P. Adam, P. Schaeffer, P. Albrecht, T. Green, and W.B. Hughes, 2003, Application of tetracyclic polyprenoids as indicators of input from fresh-brackish water environments: Organic Geochemistry, 34/3, p. 441-469. Lüning, S., J. Craig, D.K. Loydell, P. Storch, B. Fitches, 2000, Lower Silurian ‘Hot shales’ in North Africa and Arabia: Regional Distribution and Depositional Model: Earth Science Reviews, v. 49, p. 121-200. Meister, E.M., E.F. Ortiz, E.S.T. Pierobon, A.A. Arruda, and M.A.M. Oliveira, 1991, The origin and migration fairways of petroleum in the Murzuq Basin, Libya: An alternative exploration model, in M.J. Salem, M.T. Busrewil, and A.M. Ben Ashour, eds., The Geology of Libya: Third Symposium on the Geology of Libya, held at Tripoli, September 27–30, 1987: Amsterdam, Elsevier, v. 7, p. 2725-2742. Peters, K.E., J.M. Moldowan, and C.C. Walters, 2005, The Biomarker Guide, Second edition: Cambridge University Press, 2 volume set, 1155 p. Rusk, D., 2001, Libya: petroleum potential of the underexplored basin centers - a twenty-first-century challenge, in M.W. Downey, J.C. Threet, and W.A. Morgan (eds.) Sedimentary Provinces of Twenty-first Century, AAPG Memoir 74, p. 429-452. Whitbread, T., 1982, Mrar Formation of western Libya - Evolution of an early Carboniferous delta system: AAPG Bulletin v. 66/8, p. 1091-1107.
Copyright © AAPG. Serial rights given by author. For all other rights contact author directly. |