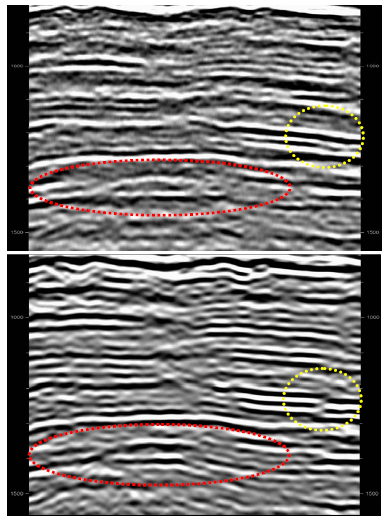
Figure 8. Results of two seismic processing data. The top portion shows the old poststack section and the bottom portion shows the reprocessed prestack version. The newly processed data shows a better signal-to-noise ratio. Note that even up one second, there were great improvements. The red ellipses show the improvements on the reservoir zone. The yellow ellipses show that the faults were better preserved on the second processing.