click image to enlarge.
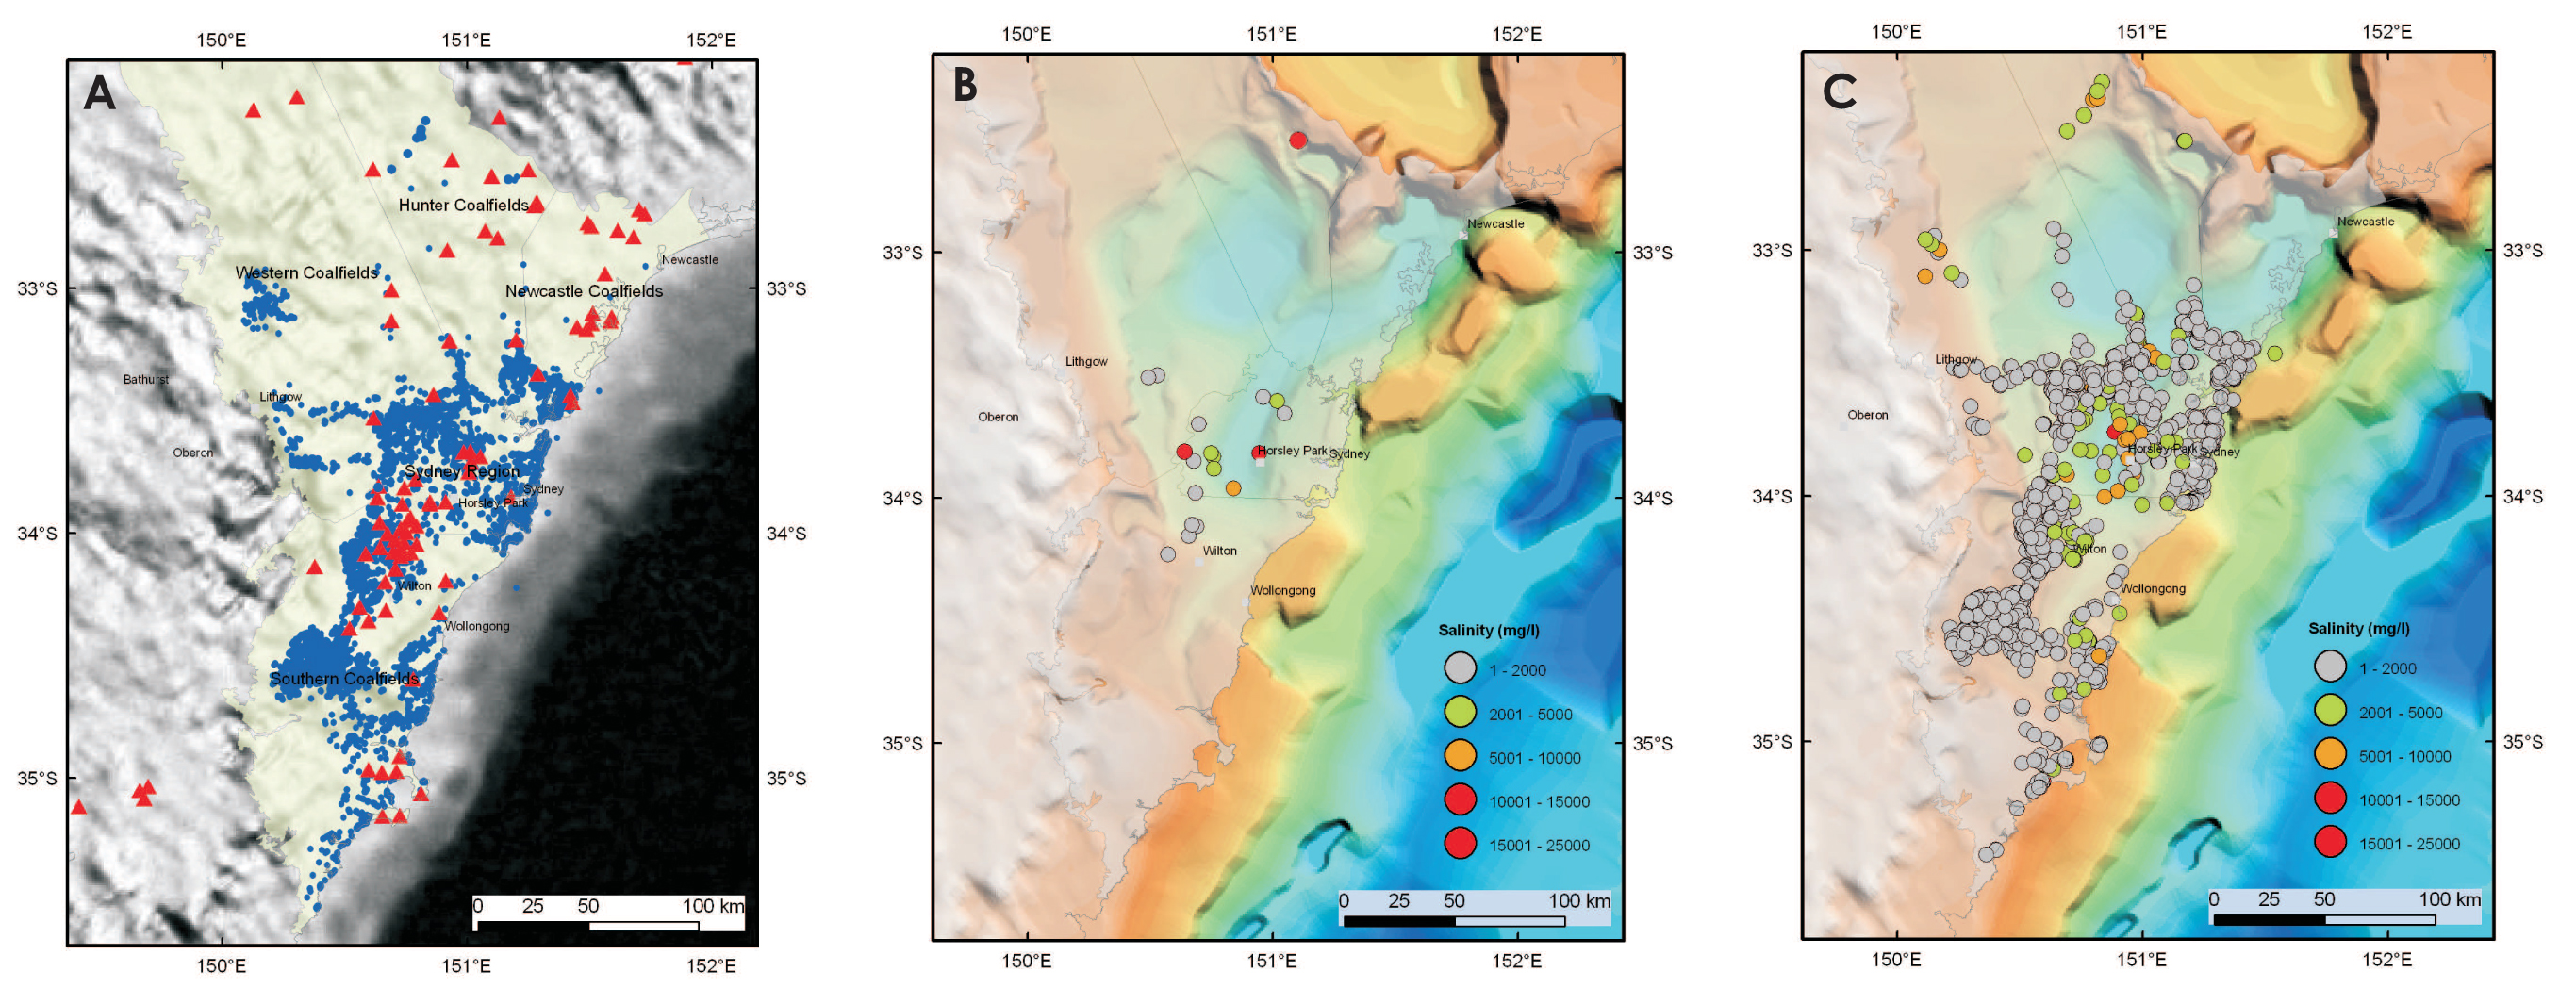
Figure 5. Hydrogeological data in the Sydney Basin: A) Location of water wells (blue) and petroleum exploration wells (red); B) Salinity distribution in shallow groundwater wells (< 250 m); C) Salinity distribution in deeper wells (> 250 m).