Click to view article (extended abstract) in PDF format.
Graphic Correlation of Biostratigraphic Data as a Powerful Tool for Oil Exploration in Frontier Deepwater Areas: A Case Study in the Brazilian Equatorial Margin*
Jorge De Jesus Picanço De Figueiredo1, Emilson Fernandes Soares1, Ivo Trosdtorf, Jr.1, João Luiz Caldeira1, Paulus Hendrikus Van Der Ven1, and Elizabete Pedrão Ferreira1
Search and Discovery Article #50190 (2009)
Posted June 3, 2009
*Adapted from extended abstract prepared for AAPG International Conference and Exhibition, Cape Town, South Africa.
1 Petrobras S.A., Rio de Janeiro, RJ, Brazil ([email protected], [email protected])
Exploration in offshore basins in the Brazilian Equatorial Margin faces a serious problem of lack of well data in deep waters. Despite the good quality of 3-D seismic over deepwater prospects, the response of seismic to the presence, distribution and quality of reservoirs is uncertain, thus precluding confident correlation between wells in the shallow platform with the deep offshore extensions.
The margin consists of six basins (from SE to NW: Potiguar, Ceará, Piauí-Camocim, Barreirinhas, Pará-Maranhão and Foz do Amazonas) straddling over 2000 km of coastline and only six deep water wells (Figure 1).
To mitigate exploration risk it is necessary to establish a reliable chronostratigraphic framework using the geological data to construct the highest possible frequency geological events charts. The recognition of variations in relative sea levels with geological time is a basic necessity, once these events can be correlated to ![]() sequence
sequence![]() boundaries in the seismic over deepwater prospects.
boundaries in the seismic over deepwater prospects.
|
|
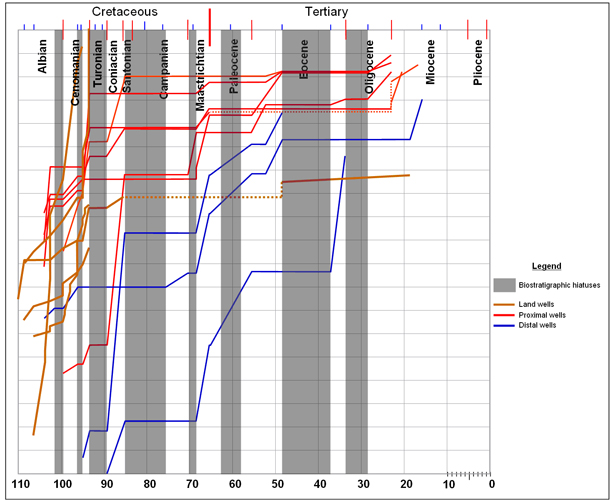
The methodology consists of graphic correlations of biostratigraphic zonation of wells in the shallow areas (Wescott et al., 1988; Neal et al., 1998; Aubry et al., 1995; Figure 2). A crossplot of biostratigraphic data on the X-axis, plotted against depth on the Y-axis was built for each well taking into account: a) its position in the basin; b) the density of data; and c) the confidence of the data. These were integrated with the global eustatic sea level chart and available seismic data, resulting in the recognition of many unconformities that reflect the main Case Study – Barreirinhas Basin
A case study of the Barreirinhas basin is presented. Results revealed the power of this methodology in establishing the
Aubry, M.P., 1995, From chronology to Feijó, F.J., 1994, Bacia de Barreirinhas: Boletim de Geociências da Petrobras, v. 8 (1), p. 103-105.
Neal, J.E., Stein, J.A., and Gamber, J.H., 1998, Nested stratigraphic cycles and depositional systems of the Paleogene Central North Sea, in Mesozoic and Cenozoic Trosdtorf, Jr., I.; Zalán, P.V., Figueiredo, J.J.P. de; Soares, E.F., in press, Bacia de Barreirinhas:. Boletim de Geociências da Petrobras.
Wescott, W.A., Krebs, W.N., Sikora, P.J., Boucher, P. J., and Stein, J. A., 1998, Modern application of
|