--> Tuning Effects' Impact on Seismic, by Gwang Lee, Keumsuk Lee, and Han Kim, #40474 (2009)
[First Hit]

Datapages, Inc.Print this page

 Click to view article in PDF format.


GCTuning Effects' Impact on Seismic*


Gwang Lee1, Keumsuk Lee2, and Han Kim3


Search and Discovery Article #40474 (2009)

Posted November 30, 2009


*Adapted from the Geophysical Corner column, prepared by the authors, in AAPG Explorer, October, 2009. Editor of Geophysical Corner is Bob A. Hardage ([email protected]). Managing Editor of AAPG Explorer is Vern Stefanic; Larry Nation is Communications Director.


1Pukyong National University

2Korea National Oil Corp

3Korea Ocean Research and Development Institute


General Statement

When reflection times are measured along the peaks, troughs or zero crossings of seismic traces, tuning effects make it difficult to measure accurate arrival times of individual reflection events. The thinnest interval over which a correct measurement of the distance between two closely spaced reflectors can be made is called the tuning thickness. The edges of reservoir bodies are often thinner than tuning thickness, and therefore a special approach – such as spectral decomposition or inversion – is required to reliably determine reservoir boundaries.


Figures

uGeneral statement

uFigures

uModel Example

uConclusions


uGeneral statement

uFigures

uModel Example

uConclusions


uGeneral statement

uFigures

uModel Example

uConclusions


uGeneral statement

uFigures

uModel Example

uConclusions


uGeneral statement

uFigures

uModel Example

uConclusions


uGeneral statement

uFigures

uModel Example

uConclusions


fig01

Figure 1. Geometry of the wedge model, mimicking a gas sand layer embedded in shale.

fig02

Figure 2. (a) Amplitude spectrum of the Ormsby wavelet used in modeling. The four corner frequencies are 4, 8, 30, and 40 Hz; (b) The corresponding zero-phase wavelet; (c) The corresponding minimum-phase wavelet.

fig03

Figure 3. (a) Synthetic seismic section when the wedge model is illuminated with the zero-phase Ormsby wavelet. Green horizons are the top and base of the wedge picked by snapping to the central trough and central peak, respectively. The lateral dimension of the wedge in units of the dominant wavelength (λ) of the Ormsby wavelet is marked along the top of the section. (b) Tuning curve for bed thickness and (c) for amplitude. The tuning thickness (λ/5) is less than the Rayleigh resolution limit (λ/4). Below 5λ/8, the amplitude tuning curve is characterized by two maxima at about λ/5 (18 m) and about λ/2 (47 m).

fig04

Figure 4. (a) Synthetic seismic section when the wedge model is illuminated with the minimum-phase Ormsby wavelet. The top and base of the wedge were picked by snapping to the leading zero amplitude (solid yellow horizon) and also to the leading trough and leading peak (solid green horizon). Manual Previous HitpickingNext Hit was used for the base of the wedge (dashed horizon) where snap Previous HitpickingNext Hit became erratic due to tuning Previous HiteffectNext Hit. The lateral dimension of the wedge in units of the wavelength (λ) of the Ormsby wavelet is marked on the top of the section; (b) Tuning curve for bed thickness and (c) for amplitude. The tuning thickness from the leading zero crossing (dashed blue line) and the trough/peak Previous HitpickingNext Hit (green line) are both about 21 m, but the errors in the tuning vicinity for the trough/peak Previous HitpickingNext Hit are larger than those from the zero-phase Ormsby wavelet. There are no tuning amplitude maxima.


Model Example


We examine the tuning Previous HiteffectNext Hit for a low-impedance wedge (Figure 1) that mimics a gas-sand layer embedded in shale. The wedge is illuminated by zero-phase and minimum-phase Ormsby wavelets that have identical frequency spectra (Figure 2). Figure 3a shows the synthetic seismic section when the wedge is illuminated by a zero-phase Ormsby wavelet. The lateral dimension of the wedge, in units of the dominant wavelength (λ = 97 m) of the illuminating wavelet, is marked on the top of the section. The top and base of the wedge (green horizons) were picked by snapping to the central trough and central peak, respectively.


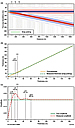
The thickness estimate and amplitude tuning curves measured from the seismic response are shown as Figures 3b and 3c, respectively. Labels are added to these curves to indicate the thickness of the wedge in units of the dominant wavelength. Trough-to-peak time measurements (Figure 3b) give the correct wedge thicknesses when the thickness is greater than about λ/5 (19 m), although side lobes produce minor errors when thickness is near this tuning value. This tuning thickness is less than the Rayleigh resolution limit (λ/4), which is commonly accepted as the threshold for vertical resolution.


When the wedge is thinner than the tuning thickness, the top and bottom reflections are pushed apart and cause arrival times to be slightly too early for the top of the wedge and slightly too late for the bottom. Thus the measured thickness is greater than the true thickness when the wedge thins to less than λ/5.


The threshold thickness above which the measured amplitude (Figure 3c) gives the correct reflectivity of the top of the wedge is about 5λ/8 (60 m). For wedge thicknesses less than 5λ/8, the amplitude tuning curve is characterized by two maxima at about λ/5 (19 m) and about λ/2 (45 m). These maxima occur when the central trough of the top reflection aligns first with the leading negative side lobe of the wavelet from the bottom interface and then with the trailing negative side lobe. As the wedge thins to less than λ/5, the amplitude decreases rapidly, reaching about -0.02, which is approximately only 10 percent of the correct reflectivity.


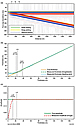
Figure 4a shows the synthetic seismic section when the wedge model is illuminated by the minimum-phase wavelet. The top and base of the wedge (yellow horizons) were picked by snapping to the leading zero amplitudes of the trough and the peak, respectively. Manual Previous HitpickingNext Hit was used for the base of the wedge where snap Previous HitpickingNext Hit became erratic due to tuning Previous HiteffectNext Hit. The top and base of the wedge (green horizons) also were picked by snapping to the leading trough and leading peak, respectively. The thickness estimate and amplitude tuning curves are shown on Figures 4b and 4c, respectively.


The thickness tuning curves from zero-amplitude Previous HitpickingNext Hit (dashed blue line, Figure 4c) and from the trough/peak Previous HitpickingNext Hit (green line) both give the correct thickness until the wedge thins to about 21 m (slightly less than λ/4). The measured amplitude of the leading trough along the top of the wedge gives the correct reflectivity of the sand/shale interface until the wedge thins to approximately λ/8, slightly larger than one-half of the Rayleigh resolution (Figure 4c). There are no amplitude maxima as exhibited by the zero-phase wavelet (Figure 3c), because the leading peak from the bottom reflection does not constructively interfere with the leading trough of the top reflection Previous HiteventNext Hit. The amplitude again decreases rapidly below the threshold thickness, reaching about -0.02.


Conclusions


Our synthetic modeling shows:   


1) Tuning thicknesses for both zero-phase and minimum-phase data are slightly less than the Rayleigh resolution limit.   


2) Previous HitEventNext Hit amplitudes can be better measured from minimum-phase data than from zero-phase data.    

3) Amplitude detuning is probably not required for minimum-phase data for bed thicknesses greater than about one-half of the Rayleigh resolution limit.


Because Previous HiteventTop amplitudes in zero-phase data are significantly affected by tuning, amplitude interpretations based on zero-phase data should be calibrated or detuned for correct amplitude analysis.


Return to top.