![]() Click to view article in PDF format.
Click to view article in PDF format.
GCSelected Low Frequencies Aid Interpretation of Deep Faults*
Bob Hardage1
Search and Discovery Article #40454 (2009)
Posted September 30, 2009
*Adapted from the Geophysical Corner column, prepared by the authors, in AAPG Explorer, September, 2009, and entitled “Looking Low Aids Data Interpretation”. Editor of Geophysical Corner is Bob A. Hardage ([email protected]) . Managing Editor of AAPG Explorer is Vern Stefanic; Larry Nation is Communications Director.
1Bureau of Economic Geology, The University of Texas at Austin ([email protected])
Numerous examples have circulated among the geophysical community that illustrate how some geologic targets can be better seen by constraining the reflected seismic wavefield to a particular narrow range of frequencies. The exact frequency range that produces an optimal image of a target varies, depending on target size, depth, thickness and impedance properties. The data discussed here document an example where frequency-constrained seismic data provided improved images of deep fault systems.
|
These seismic data come from a 3-D seismic survey acquired in West Texas. The principal objective was to image deep gas reservoirs
at depths of approximately 20,000 feet (6,000 meters). The seismic grid traversed an area where the exposed surface layer had large variations
in impedance and thickness caused by the dissolution of exposed salt and anhydrite and the infill of younger, unconsolidated sediment. This
variable-velocity surface layer made static corrections of the seismic data difficult. Because of this static-calculation issue and the great
depth of the targets, seismic data quality was not as good as desired for reservoir characterization and drill site
Across the study area, the deep reservoir interval was traversed by numerous faults, making accurate fault mapping one of the
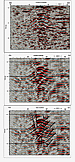
keys to exploiting the reservoir system. One example of a seismic profile crossing a key
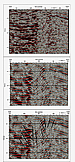
In all profiles that traversed the study area, it was found that deep faults were consistently better defined by data that were frequency constrained to emphasize only the low-frequency response. To illustrate this point, a second profile across the geologic target is shown on Figure 2 , using the same sequence of data panels used in Figure 1 . Again, the low-frequency image is a better depiction of the deep faulting pattern.
What is the message? If you are confronted by the problem of interpreting faults in limited-quality seismic data, try viewing the fault system with the low-frequency portion of the data bandwidth. If the fault throws are significant – as in these examples – data that are constrained to the first octave of the frequency spectrum may allow the faults to be better seen and interpreted.
|