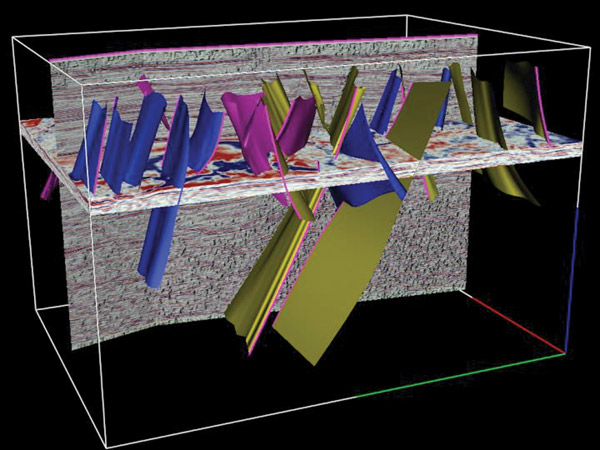
Figure 2. Visualization of faults and corendered seismic data. More than 40 faults were mapped in the data volume, but for clarity not all are shown in this display. Although seismic data quality deteriorates below the Cretaceous, most of the faults demonstrably die out downward at this level.