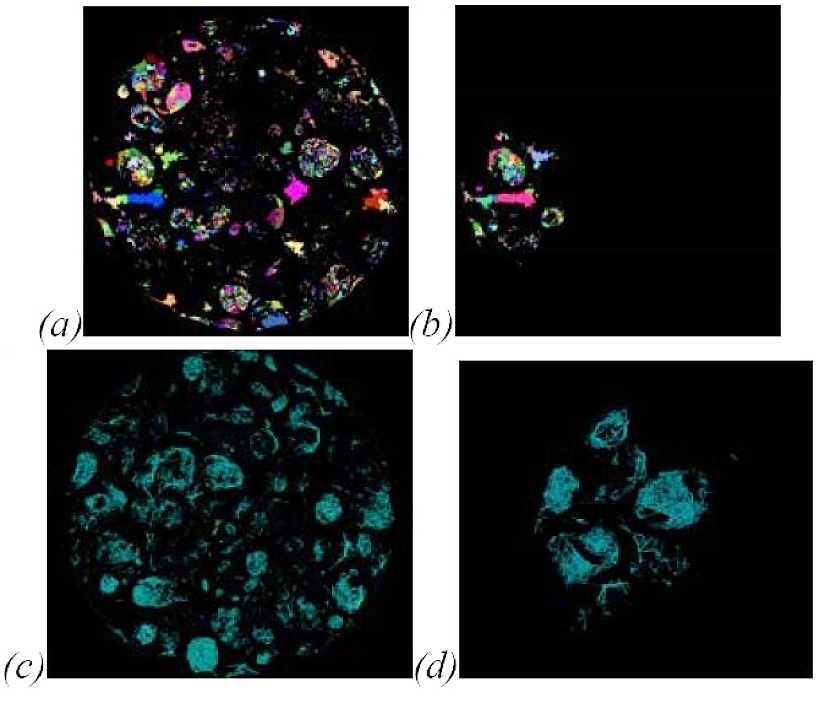
Figure 4. Pore partitioning of sample in lower left of Figure1 shown by different colors; (a) shows the partitioning of all pores, while (b) shows the macroscopically connected pores only; a small subset of the pore space is connected; (c) shows the network based analysis of all pores while (d) shows the connected porosity.