Click image to view enlargement.
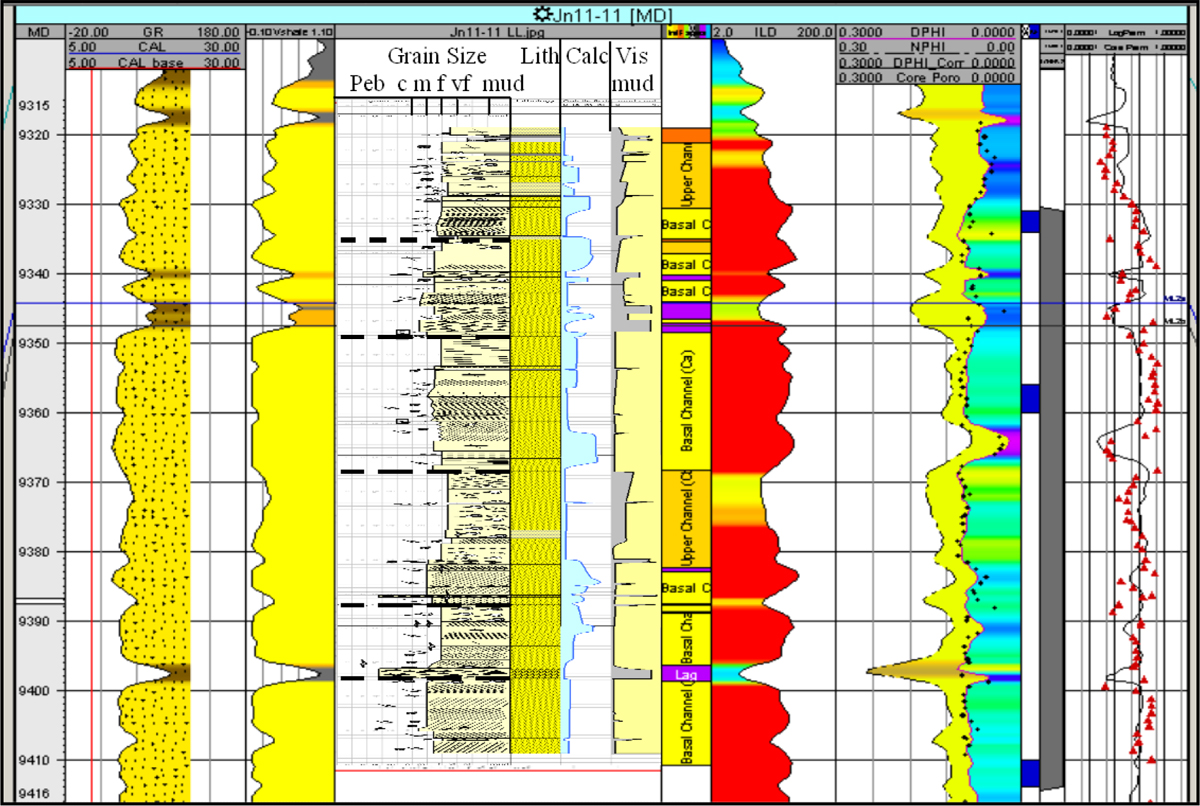
Figure 6. Log and core plot of a multi-story channel sequence in the Jensen 11-11 well. Data tracks from left to right include: Measured depth (feet), Gamma ray and Caliper, Vshale (yellow < 0.4), Core grain size and stratification – dashed lines indicate storey boundaries, Core lithology, Core calcite reactivity to acid (blue increases to right), Core visible mud fraction, modeling facies class, resistivity (red > 16 ohm-m), Neutron-Density porosity with core porosity (black dots), perf zones (blue bars), Frac stage (grey bar), and Permeability (log derived from k-phi transform is black line, red triangles indicate stressed core permeability).