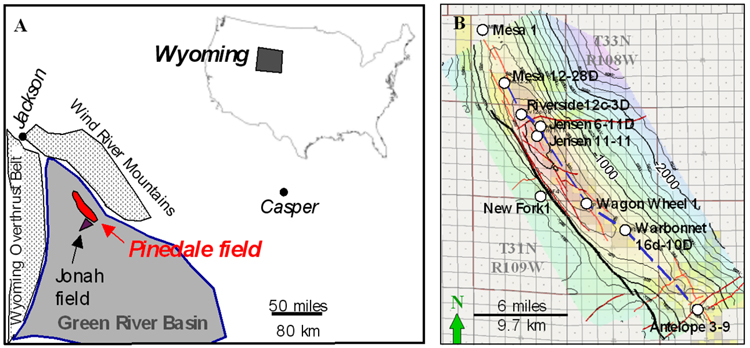
Figure 1. (A) Location map of Pinedale field, Wyoming, United States. (B) Structure contour map on Gamma Ray marker covering southern 2/3 of the field, created from 3D seismic interpretations by A. Robertson and R. Whale (contour interval 200 ft). Locations of wells mentioned in the text or figures are shown. Heavy black lines indicate structure-bounding reverse faults. Red lines indicate smaller faults. Blue dashed line indicates well log cross section shown in Figure 4.