Click on each map for enlargement.
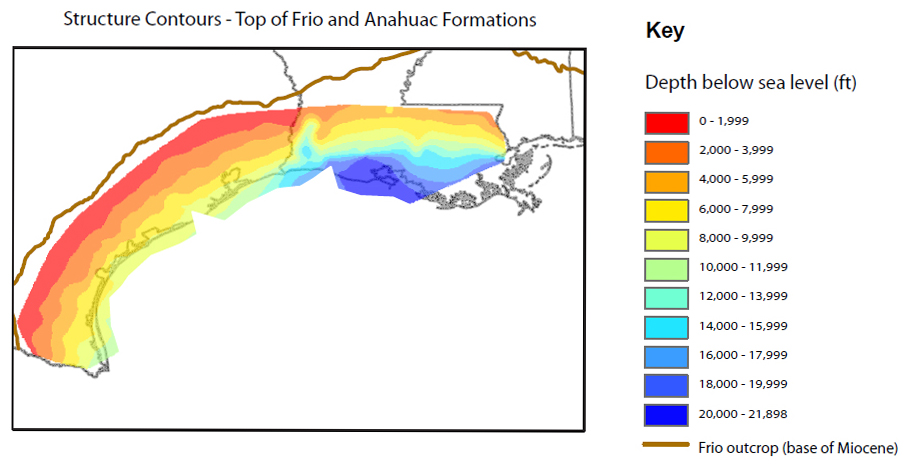

Figure 4. Structure contours showing depth (from sea level) to the top of the Frio Formation (A) and total thickness of the Frio Formation (B). The Anahuac Formation is included within the Frio in these maps. Maps were generated from published cross sections (Bebout and Gutierrez, 1982, 1983; Dodge and Posey, 1981).