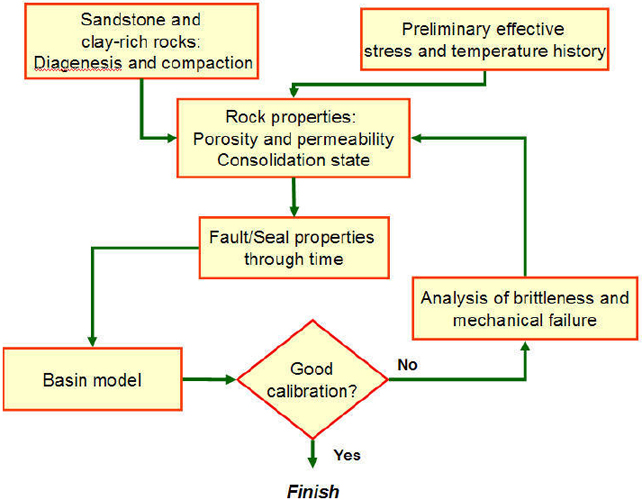
Figure 1. Flow chart showing the general workflow for modeling the fault behavior for a siliciclastic section in basin models. Preliminary effective stress and temperature history computations are utilized to calculate fault / seal properties through geologic time, which are inputs for 2D / 3D basin models. Calculated pressure and effective stress are compared to well data, and rock properties are modified and sent back to basin models. Iterations are performed until there is a good fit to calibrations data.