Click on image to view enlargement.
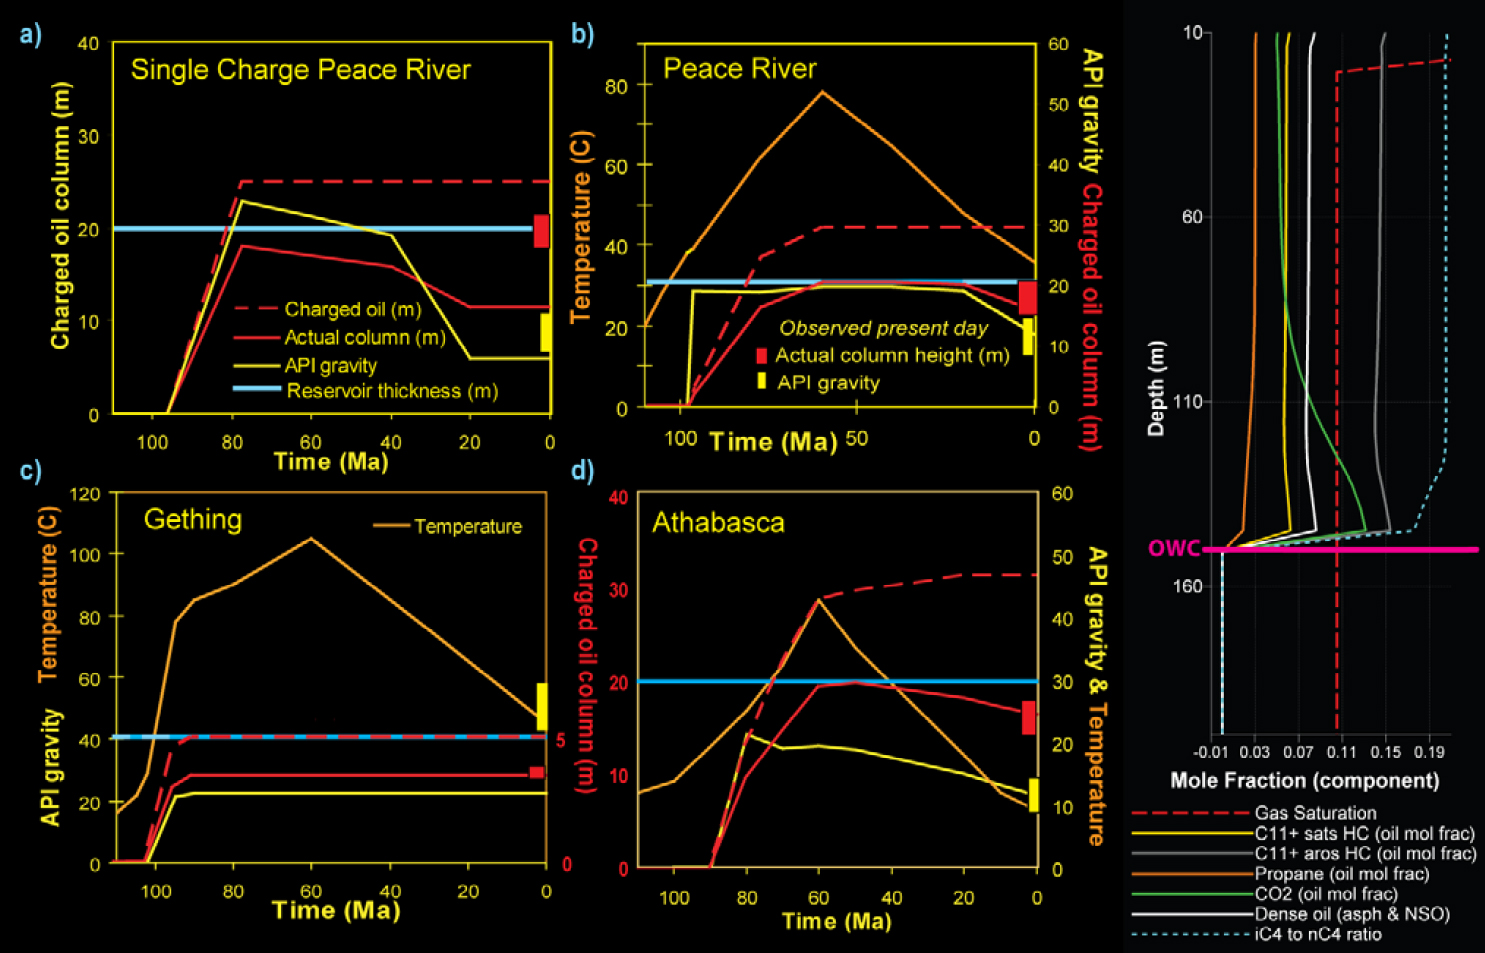
Figure 2. Charge-degrade models (see Larter et al. 2006a for details) for Alberta tar sand reservoirs, showing cumulative charged oil, remaining (actual) oil column in terms of oil column height in the context of oil quality and reservoir temperature: a) assumes a single instantaneous charge of all oil at 95 Ma and degradation to present day for Peace River; b) continuous charge into Peace River until maximum burial (60 Ma) and simultaneous degradation to present day; c) pasteurization of Gething reservoirs curtails degradation shortly after charge starts; and d) Athabasca reservoirs exist at optimal conditions for degradation and require charge after maximum degradation. The concentration-depth profile for oil components after 65 kyr of degradation show slight accumulation of non-degradable dense oil near the OWC and preferential removal of propane and n-butane over i-butane, with lesser alternation of C11+ hydrocarbons, generation of CO2 and formation of gas cap.