Click on image to view enlargement.
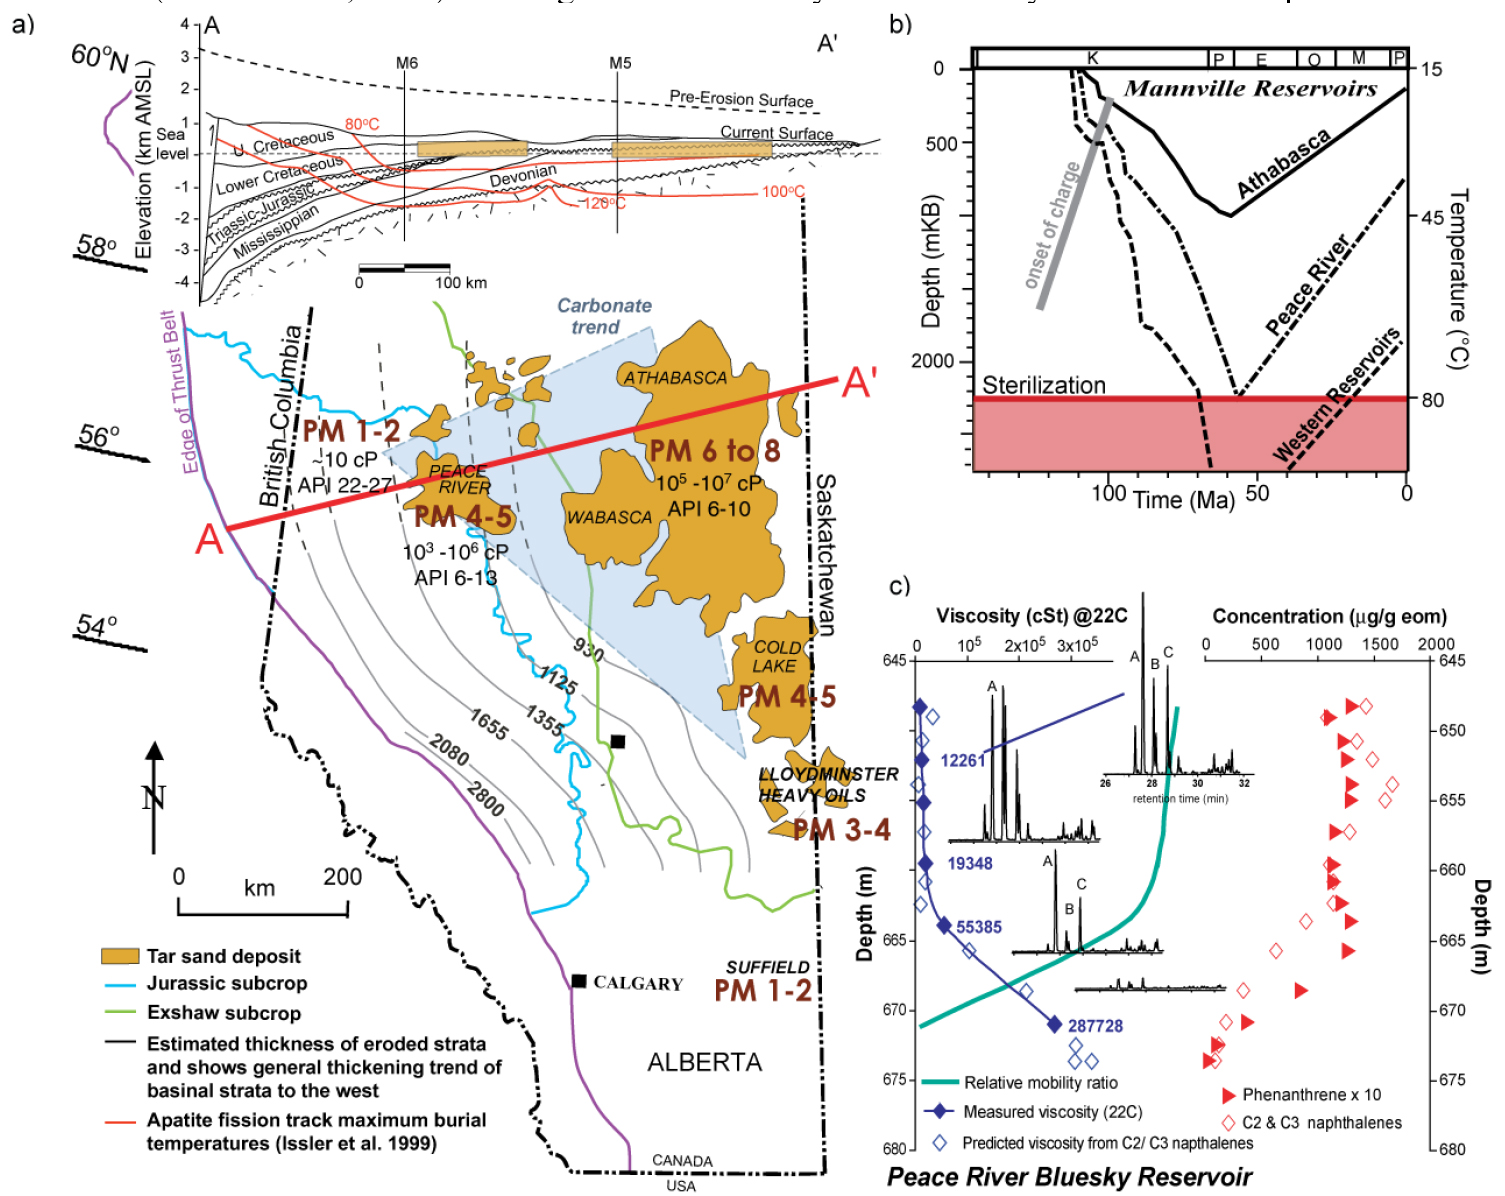
Figure 1. a) Map of Alberta oil sands showing level of biodegradation as PM level (Peters and Moldowan, 1993) and average fluid properties. Cross-section shows maximum burial temperatures as inferred from apatite fission track modeling (Issler et al., 1999). M5 and M6 are the location of the fifth and sixth meridians, respectively. b) Burial history curves, based on 1D thermal basin models, show how increasing temperature is related to limiting biodegradation. c) Viscosity increases and thus mobility (as a function of effective permeability) decreases by orders of magnitude with depth towards the OWC, and the associated variation in aromatic hydrocarbon concentrations is shown with preferential removal of these compounds by micro-organisms at the OWC.