Click on image to view enlargement.
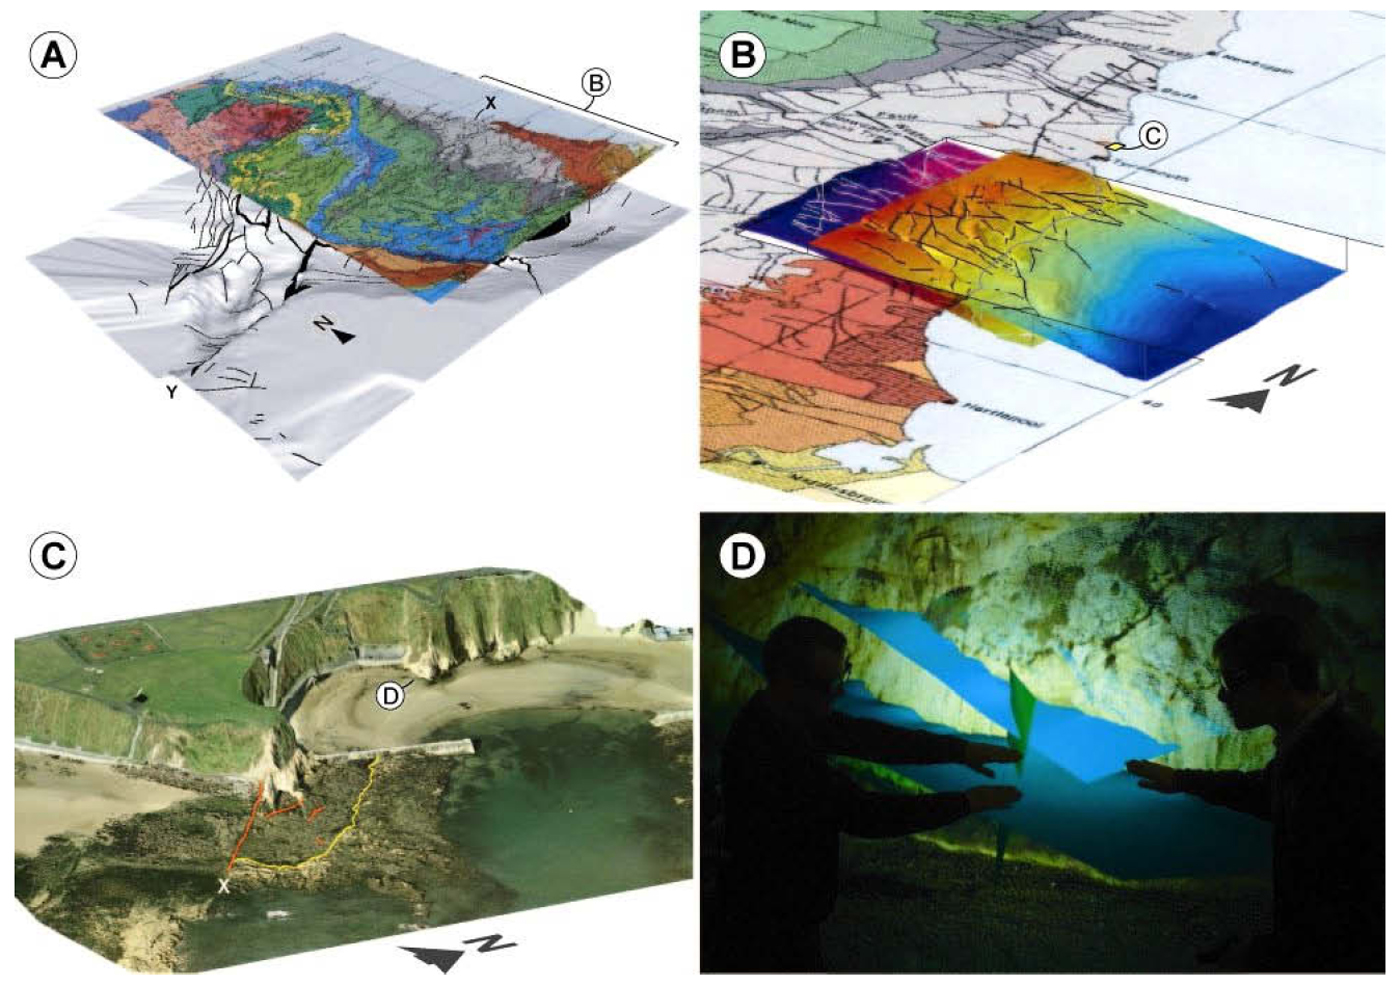
Figure 3. Example of integrated multi-scale 3D geological model from NE England, spanning seven orders of magnitude, from Jones et al. (2007, in press): (A) regional scale, showing the solid geology at the Earth’s surface, above a surface showing basement topography: field of view ca. 1.6 x 10⁵ m. X and Y mark traces of the 90-fathom/Stublick fault system on the surface and at top basement, respectively; (B) subsurface data at sub-regional scale; the Maudlin coal seam (lower surface) and Carboniferous-Permian unconformity (upper surface); width of subsurface area covered ca. 2.5 x 10⁴ m. These surfaces are shown embedded within a cut-away geology map of Tyneside-Teesside; (C) local scale with integration of geological boundaries draped onto local topography: X is the trace of 90-fathom fault on the foreshore. The field of view ca. 5 x 10² m, location shown in (B); (D) outcrop scale, showing interpretation of detailed terrestrial laser-scan data in an immersive 3D visualisation facility: field of view ca. 3 x 101 m, location given in (C); laser-scan point spacing ca. 2 x 10⁻² m.