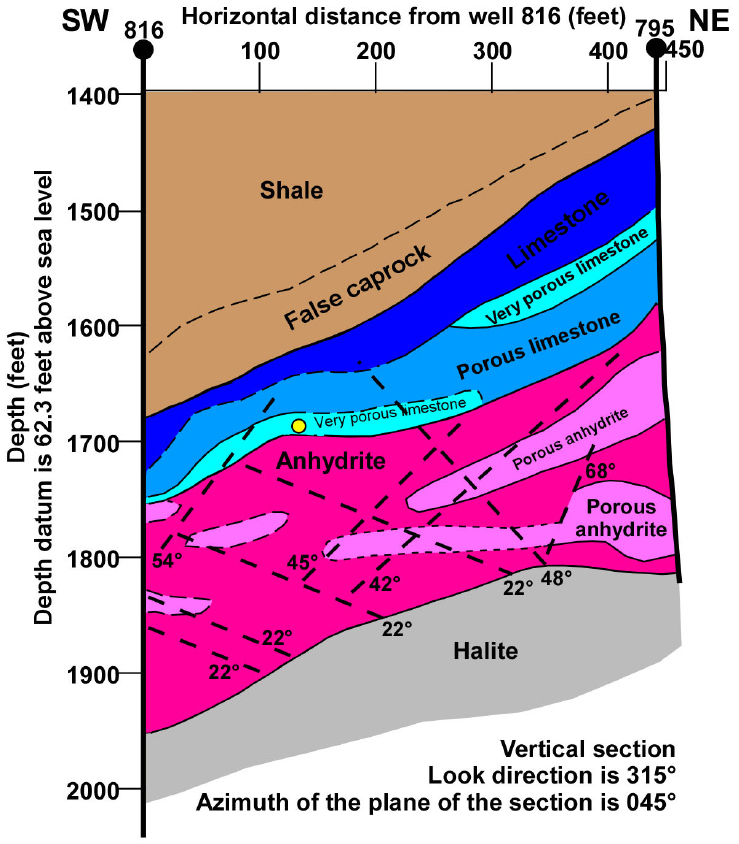
Figure 7. Geologic interpretation of the crosswell velocity and diffraction tomograms between the 795 and 816 wells, based on well data (core, image logs, crossed-dipole sonic logs, and conventional logs). The yellow circle marks where the horizontal well penetrated the plane of the tomogram. Prominent faults are shown as heavy dashed lines with their apparent dip angles as measured in the plane of the tomogram. Vertical:horizontal scale = 1:1.