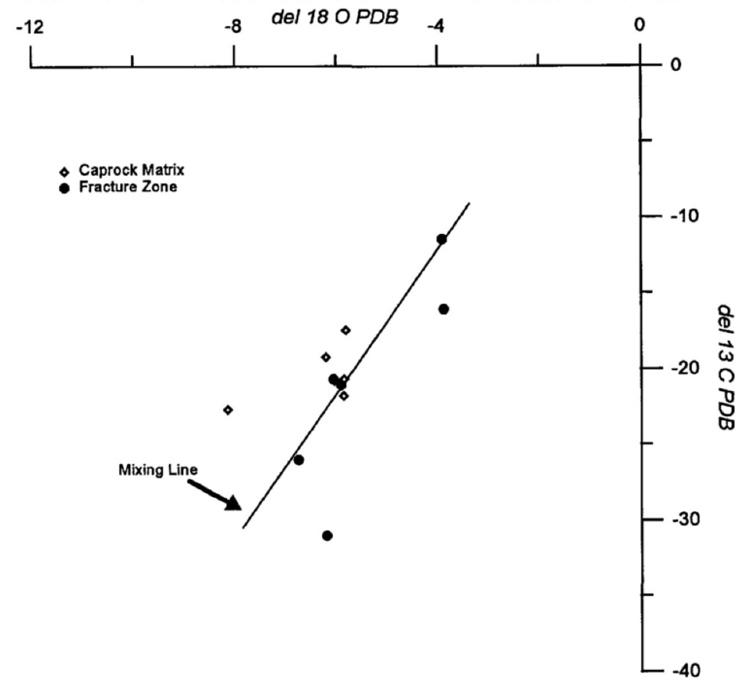
Figure 3. Carbon and oxygen isotopic composition, Sour Lake limestone and anhydrite fracture zones. Plot shows a mixing line that we interpret to result from mixing of meteoric water and formation water influenced by sulfate-reducing bacteria.
Figure 3. Carbon and oxygen isotopic composition, Sour Lake limestone and anhydrite fracture zones. Plot shows a mixing line that we interpret to result from mixing of meteoric water and formation water influenced by sulfate-reducing bacteria.