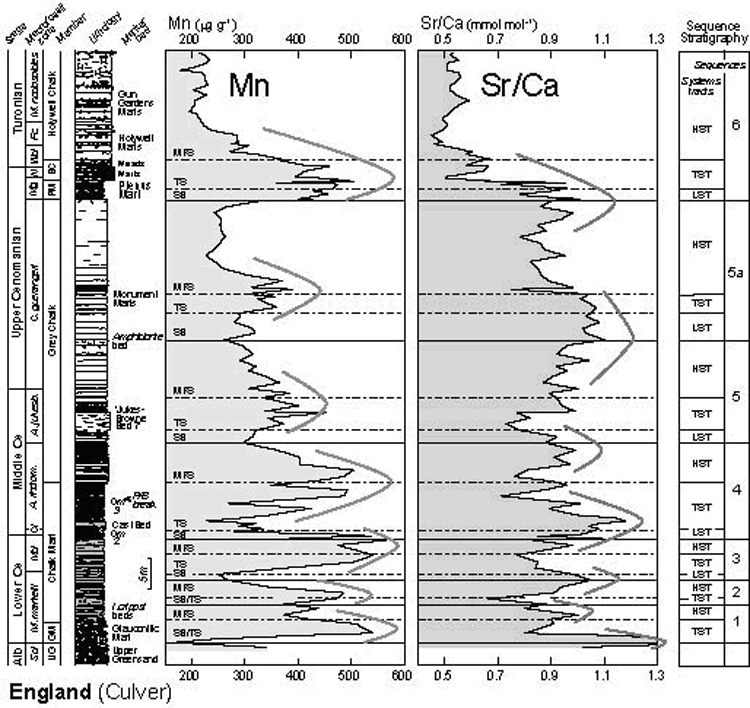
Figure 5. Stratigraphy, manganese, and Sr/Ca ratio curves for the Cenomanian of Culver, England. General trends in the Mn and Sr/Ca stratigraphy are indicated by solid gray curved lines. Stratigraphic abbreviations as in Figure 2. Sequences after Robaszynski et al. (1998) and Jarvis et al. (2001). SB, sequence boundary; TS, transgressive surface; MFS, maximum flooding surface; HST, highstand systems tract; LST, lowstand systems tract; TST, transgressive systems tract .