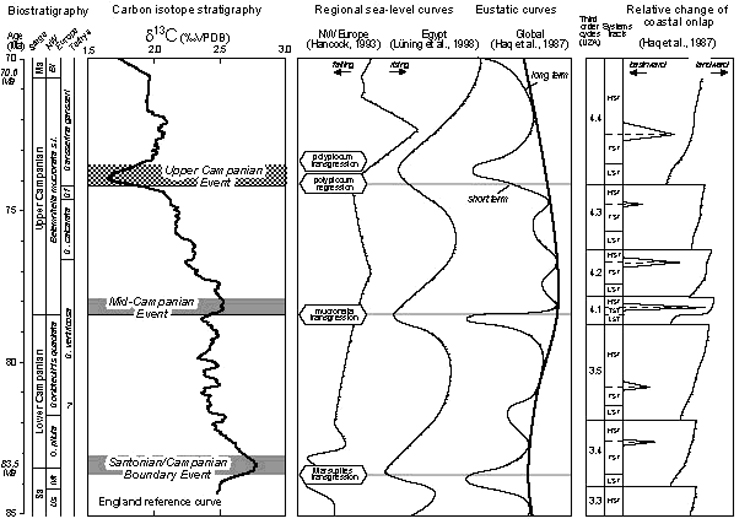
Figure 4. Campanian sea-level change versus carbon isotope stratigraphy. The d13C reference curve is a five-point moving average of the Trunch data replotted using the time scale of Ogg et al. (2004). The curve has been calibrated using the base Campanian (83.5 Ma) and base Maastrachtian (70.6 Ma), and assumes a constant sedimentation rate at Trunch. The three main Campanian isotope events are indicated. The relative positions of the NW European macrofossil and Tethyan planktonic foraminifera biostratigrahies are based on the carbon isotope correlation shown in Figure 3. The global eustatic curve (Haq et al., 1987) has been re-calibrated by placing the base of TST3.4 at the bottom of the Santonian / Campanian Boundary Event, the base of TST4.1 at the base of the Mid-Campanian Event, and the base of TST4.4 at the top of the Upper Campanian Event, and scaling the remainder of the curve accordingly. HST, highstand systems tract; LST, lowstand systems tract; SST shelf-margin systems tract; TST, transgressive systems tract. Modified from Jarvis et al. (2002).