Print this page
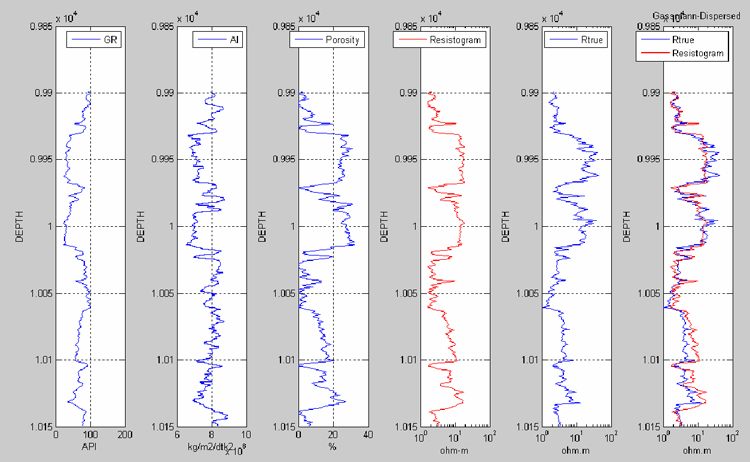
Figure 3. Acoustic impedance log and synthetic resistivity curves (red) for B-sand (dispersed shale).