 Click to view article in PDF format.
Geothermal Gradients and Subsurface Temperatures in the Northern Gulf of Mexico*
By
Joseph Forrest1, Ettore Marcucci1 and Paul Scott2
Search and Discovery Article #30048 (2007)
Posted February 25, 2007
*Adapted from article prepared for presentation at GCAGS Convention, New Orleans, September, 2005, which was canceled due to Hurricane Katrina. Article is published in GCAGS Transactions, 2005, v. 55, p. 233-248. Appreciation is expressed to GCAGS for permission to post this article.
1Resource GeoServices LLC, 10700 Richmond Ave., Houston, Texas 77042 ([email protected])
2Marathon Oil Company, 5555 San Felipe Road, Houston, Texas 77056
Abstract
Geothermal gradients have been calculated in 1131 fields and wells, and a map
has been prepared showing the below-mudline ![]() depth
depth![]() to the 300oF
subsurface isotherm over the northern Gulf of Mexico. Since the 300oF
isotherm values are a direct reflection of thermal gradient, thermal
conductivity, and heat flow, the map may be considered as a portrayal of
subsurface temperature distribution. Based on interpreted vertical and
horizontal temperature patterns, the northern Gulf can be subdivided into six
thermal domains. The Texas shelf domain shows the highest subsurface
temperatures with a pattern of elongate, northeast-trending isotherm contours
related to the regional pattern of faulting. A prominent temperature high
perpendicular to the regional trend may reflect the southeast-plunging San
Marcos arch. The High Island domain coincides with a late Miocene depocenter and
has anomalously low temperatures caused by either a deep overpressure zone or
shallow thermal conductive zone. Moderately high temperatures and a pattern of
isotherm contours related to salt features characterize the Louisiana shelf
domain. The Mississippi Canyon domain coincides with the Mississippi fan and
displays very low temperatures due to thermal suppression from thick, rapid
Quaternary sedimentation. The Walker Ridge domain coincides with the
Texas-Louisiana slope and has the coolest temperatures found to date in the
northern Gulf. The Alaminos Canyon domain falls within the Northwest slope and
the Perdido diapir provinces and displays temperatures intermediate in value
between the Texas shelf and Walker Ridge domains.
to the 300oF
subsurface isotherm over the northern Gulf of Mexico. Since the 300oF
isotherm values are a direct reflection of thermal gradient, thermal
conductivity, and heat flow, the map may be considered as a portrayal of
subsurface temperature distribution. Based on interpreted vertical and
horizontal temperature patterns, the northern Gulf can be subdivided into six
thermal domains. The Texas shelf domain shows the highest subsurface
temperatures with a pattern of elongate, northeast-trending isotherm contours
related to the regional pattern of faulting. A prominent temperature high
perpendicular to the regional trend may reflect the southeast-plunging San
Marcos arch. The High Island domain coincides with a late Miocene depocenter and
has anomalously low temperatures caused by either a deep overpressure zone or
shallow thermal conductive zone. Moderately high temperatures and a pattern of
isotherm contours related to salt features characterize the Louisiana shelf
domain. The Mississippi Canyon domain coincides with the Mississippi fan and
displays very low temperatures due to thermal suppression from thick, rapid
Quaternary sedimentation. The Walker Ridge domain coincides with the
Texas-Louisiana slope and has the coolest temperatures found to date in the
northern Gulf. The Alaminos Canyon domain falls within the Northwest slope and
the Perdido diapir provinces and displays temperatures intermediate in value
between the Texas shelf and Walker Ridge domains.
|
|
Figure and Table Captions
Approximately 44,000 oil and gas
exploratory and development wells have been drilled in the US
Federal waters of the northern Gulf of Mexico since 1947 (Figure
1). These wells have encountered a variety of temperature
conditions that range from abnormally low to abnormally high,
indicating that the pattern of subsurface heat in the basin is
complex. Limited data has been published documenting temperatures in
specific wells, fields, or local areas, but the only regional
temperature analyses of the area are
The
result of our analysis is a map that illustrates below-mudline (BML)
depths to the 300-degree (BMLD300) subsurface isotherm throughout
the northern Gulf. This map can be considered as a portrayal of
subsurface temperature distribution, as the BMLD300 values are a
direct reflection of thermal gradient, thermal conductivity, and
heat flow. The map illustrates the complexity of subsurface
temperatures in the northern Gulf. In some cases this complexity can
be related to known geological conditions, but in other cases the
relationship is ambiguous. The most serious shortcomings of the map
are (1) its dependence on average values for calculating thermal
gradients, (2) a mixed source of original temperature values
(derived from both non-equilibrium BHT data measured during logging
runs and temperatures measured during bottom-hole pressure surveys)
and (3) the relative paucity of data in deep-water areas (>1,000 ft
of water
Geothermal Gradients in the Northern Gulf of Mexico
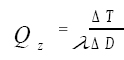
It is well established that temperatures
increase with
where:
Qz = Heat flow per unit area in the vertical direction l = Thermal conductivity
Blackwell and Richards (2004) present the
most recent interpretation of heat flow in the Gulf of Mexico as
part of their Geothermal Map of North America, but little data on
thermal conductivity is available for the region. The thermal
maturation Since heat flow and thermal conductivity data are rarely available for petroleum applications, bottom-hole temperatures measured in boreholes are the principal basis for calculating geothermal gradients. The basic equation for the calculation, and the method utilized in this study, is as follows:
Problem of Mean Annual Surface Temperature
In calculating geothermal gradient using
equation 2 a value of mean annual surface temperature is subtracted
from the measured BHT before being divided by the formation
Good data is available for water
temperatures versus
The gradient calculated for each field or
well is based therefore on a mud-line temperature that reflects the
water
Calculating Geothermal Gradients and BMLD300 ValuesTwo sources of data were used to derive geothermal gradients from which the BMLD300 was calculated:
The main data source was the Minerals
Management Service’s 2001 publication “Atlas of Northern Gulf of
Mexico Gas and Oil Sands.” In that work the MMS calculated a series
of weighted reservoir parameters for sands in fields recognized as
of January 1999. The MMS defined a “sand” as all productive
formations in a field that are geologically correlative. Reservoir
characteristics for all sands were calculated, weighted according to
the relative importance of the reservoir in the field, and averaged.
A particular sand’s temperature may be derived from many wells in a
field or from only one well, if only one produces from the
formation. Average weighted values obviously do not reflect all possible variation in temperatures in a field. However, as discussed in an earlier section, obtaining a regional grid of good static bottom-hole temperatures from wells is essentially impossible in the Gulf. We recognize the weakness in the data, but feel strongly that it still allows a valid regional overview of temperature distribution. An obvious advantage of the MMS data set is its large size (13,000 average sand temperatures from 1041 fields) and its good regional distribution. Locations of the fields that were used are shown in Figure 4.
Since the data available from the MMS
Atlas publication covers only fields recognized up to January 1999,
it was necessary to add data from individual wells to give better
coverage to deep-water areas, which have a limited number of fields.
We reviewed 4500 logs from 250 deep-water wells in which the BML
total
To calculate gradients, an Excel
spreadsheet was developed that contained all data points for each
field and well. The BML
After establishing the gradient lines,
values were extracted from each plot to calculate a gradient and a
BMLD300 value (Figures 5,
6, and 7).
If a field demonstrated dogleg gradients (see next section for
discussion), the temperature of the deepest point above the deepest
dogleg was recorded, and the gradient of this last step was used to
calculate the
Dogleg Thermal Gradients
A commonly observed phenomenon in the
Gulf Coast and Gulf of Mexico is that geothermal gradients have two
or more distinct linear segments, indicating that the gradient
varies in a step-like fashion with In this study multi-linear, or dogleg, geothermal gradients have been observed throughout the northern Gulf, but not in all fields and wells. In many fields the gradient trend shows no obvious change in rate (Figure 5). This may reflect the true gradient situation in the field, or the data may not extend deep enough to intersect an insulating or conducting zone (Lewis and Rose, 1970), such as an overpressure zone or zone of thermal conductivity change. The apparent non-occurrence of insulating zones in many plots may reflect as well the fact that geothermal gradients calculated in fields by the MMS are almost exclusively derived from sand reservoirs. The plots contain little or no temperature data from shales, which form the great bulk of the Gulf of Mexico’s stratigraphic section and are commonly the insulating zones. Multiple doglegs are interpreted to occur in many fields in the study (Figures 6 and 7). Though it was out of the scope of the present work, we feel that mapping the distribution of dogleg thermal gradient zones could be useful in determining regional patterns of overpressure and thermal conductivity change.
Subsurface Temperature Distribution in the Northern Gulf
Mapping BMLD300 ValuesTo map the BMLD300 values we used the field outlines published by the MMS in the 2001 Atlas study. A latitude-longitude centroid was calculated for each field and this was the point used to map the BMLD300 value in the field. Values for wells were plotted at the bottom-hole locations. Contouring was carried out initially with the automated contouring package Surfer 8.0 (trademark of Golden Software, Inc., 809 14th Street, Golden, CO 80401), using the Kriging method with a very dense gridding interval. Most of the fields in the Gulf of Mexico produce from multiple sands, and in many cases not all the sands in a field are stacked vertically; some sands may be located in a position displaced from the main body of the field. Every sand in a field was, therefore, assigned a centroid and the same BMLD300 value, so that displaced sands would be mapped within the contour value of the field. The results were good, but since each field area is represented in the gridding process by a single point, the boundary areas of some fields and sands are partially contained in adjacent contours. The completed Surfer map was converted to an ESRI (Environmental Systems Research Institute, Inc., 380 New York Street, Redlands, CA 92373) shapefile and loaded into ArcGIS 9.0 (trademark of ESRI). The contours were converted to closed polygons, and extraneous lines were cleaned up for final map presentation.
Distribution of Subsurface Temperatures in the Gulf
Figure 8 is
the completed interpretation of BMLD300 values for the northern
Gulf. The most remarkable aspect of temperature distribution is the
distinct differentiation between shelf and deep-water areas. The
shallowest BMLD300 values, and thus the highest thermal gradients
and heat flow, occur on the Texas-Louisiana shelf, which is the area
above 300 m (984 feet or approximately 1000 feet) water
In the deep-water areas, below 300 m of
water, the BMLD300 values range from 11,000 to 45,000+ feet, with
most common range being from 21,000 to 37,000 feet. Further
differentiations can be made within the deep-water areas between
water
The average geothermal gradient, and
therefore subsurface temperature, tends to be lower in the
deep-water areas than on the shelf. This point is illustrated in
Figure 9, which shows the range of
BMLD300 values and the midpoint Though we feel that the general trend of cooler temperatures in deep-water areas is real, it should be noted that temperature patterns throughout the northern Gulf show a great range of variability. There are areas on the shelf that are nearly as cool as those in the deep- water, and areas in deep-water as warm as those on the shelf.
Temperature DomainsEven a casual glance at Figure 8 suggests that the area of the study can be divided readily into distinct areas of temperature distribution. We have interpreted six “temperature domains,” which we define as regional geographic areas that share noticeable similarities in their temperature distribution patterns, which can be related to geological factors in the area (Figure 10).
The Texas Shelf DomainThis area, which includes the Texas shelf and a portion of the western shelf of Louisiana, has the highest temperature gradients and broadest pattern of shallow BMLD300 values in the northern Gulf of Mexico. The shallowest BMLD300 value occurs in the Brazos 437 (BA437) field at 9700 feet. The range of BMLD300 values in the domain is 9700 to 25,000 feet, but the dominant depths range from 13,000 to 17,000 feet. Several temperature patterns that can be directly related to geological features occur in the domain. The northeast-trending BMLD300 contour pattern in the domain is consistent with the known geology of the Texas offshore, which is dominated by northeast-trending fault systems that extend for long distances. The coincidence of the high temperature zone that falls along the Corsair fault trend suggests a causative relationship (Figure 11). Bodner and Sharp (1988) found similar temperature highs concentrated along the trends of the Wilcox and Vicksburg fault systems, which parallel the Corsair and are located to the west of it onshore south Texas. Perpendicular to the Corsair thermal high is a northwest-trending high-temperature zone (shown by the 13,000-15,000-foot BMLD300 contour) that extends from the Brazos area across Brazos South, Galveston South and into East Breaks. This feature parallels the trend of the San Marcos arch, a basement nose that plunges southeast from the Llano uplift.
High Island DomainWithin the Texas shelf domain is another anomalous area centered approximately in the High Island region. This area is bounded to the northwest by the Corsair fault trend and is the site of a late Miocene depocenter, as outlined by Winker (1982). BMLD300 values in the domain range from 17,000 to 23,000 feet, classifying it as anomalously cool in relationship to the surrounding Texas shelf domain. We speculate that a deep overpressure zone or a shallow conductive zone may underlie the High Island domain. Reference to Figure 1 shows that the High Island domain is also an area of remarkably low-drilling density.
Louisiana Shelf DomainThis area is characterized by BMLD300 values that range from 13,000 to 33,000 feet, with a most common range of 15,000 to 19,000 feet. In addition to being generally cooler than the Texas shelf domain the pattern of temperature distribution is dominated by numerous small “bulls-eye” contour anomalies, which contrast with the elongate pattern of contours on the Texas shelf. This pattern is most likely a reflection of salt dome tectonics that have produced the short, arcuate fault system pattern that characterizes the Louisiana shelf. High temperature anomalies are often associated with salt domes (Gretener, 1981). We have compared the pattern of BMLD300 anomalies to the pattern of known salt domes on the Louisiana shelf and find good general agreement, though not absolute coincidence. In an investigation of geothermal patterns around salt domes in south Louisiana, Kumar (1989) found that there is a general rise in temperatures in the vicinity of domes but that isotherms do not always conform to them.
Mississippi Canyon DomainThis deep-water area coincides with the Mississippi fan, a large complex that extends south from the edge of the Louisiana shelf to abyssal depths and consists of a thick section of Quaternary submarine deposits. BMLD300 values in the domain range from 23,000 to 43,000 feet, with the most common depths ranging from 27,000 to 37,000 feet. Mello and Karner (1996), Jones and Nagihara (2003), and Jones et al. (2003) have suggested that the rapid deposition of a thick section of young sediments in the fan has suppressed regional isotherms, resulting in anomalously low surface heat flow.
Walker Ridge domainThis deep-water domain coincides with the Texas-Louisiana slope and is characterized by salt diapirism, lateral emplacement of salt tongues and sheets, and from mass downslope transport of surface sediments. Worrall and Snelson (1989) have interpreted the Texas-Louisiana slope as a large overthrust complex in which salt forms the basal thrust surface and in which salt is tectonically thickened relative to the shelf areas. BMLD300 values range from 25,000 to 56,000 feet, with the most common values in the range of 29,000 to 43,000 feet. It is tempting to relate the deep BMLD300 values in some way to the dominance of salt-related phenomena in the domain, but Jones et al. (2003) have concluded that lateral salt tongues, such as those that characterize the Texas-Louisiana Slope, do not affect heat flow. There is no evidence in the domain of the rapid thick sedimentation that has formed the Mississippi fan to the east. The low geothermal gradients in the area are indeed anomalous, and we cannot relate them at the present time to any known geological features. It should be noted however that data control in the area is sparse and that interpretation of thermal conditions in the area will no doubt become clearer with additional data points.
The Alaminos Canyon DomainThis deep-water area displays BMLD300 values that are intermediate between those of the Texas Shelf and Walker Ridge domains. The values range from 13,000 to 27,000 feet, with predominant values from 21,000 to 25,000 feet. The area of the Alaminos Canyon domain falls within two geological provinces described by Ewing (1991), the Northwest slope diapir province and the Perdido diapir province. The Northwest slope province has less salt-tectonic activity and a thinner stratigraphic section compared to the adjacent Texas Louisiana Slope. Though the Perdido province displays considerable salt tectonic activity, the salt is fairly continuous compared to the Texas-Lousiana slope to the east and the stratigraphic section is thinner, not displaying the massive, rapid sedimentation seen to the east. Like the Walker Ridge domain, the Alaminos Canyon area suffers from sparse data, and its interpretation will most likely change with additional control.
Conclusions
Equilibrium bottom-hole temperature data
in the northern Gulf of Mexico is difficult to obtain, but the use
of the large set of field-based sand data from the MMS supplemented
by wells gives a valid regional picture of thermal trends in the
basin. The interpreted pattern of BMLD300 (below-mudline Despite its data weaknesses the BMLD300 map gives a good preliminary overview of thermal conditions in the northern Gulf and can be used readily by drilling engineers and basin modelers as an indication of present-day subsurface temperature distribution.
AcknowledgementsThe authors gratefully acknowledge the Synthetic-Based Mud Research Group for financial support of this project and for their permission, with that of the American Petroleum Institute, to publish this paper.
ReferencesBlackwell, D.D., and M. Richards, 2004, Geothermal Map of North America: AAPG. Blackwell, D.D. and J.L. Steele, 1989, Thermal conductivity of sedimentary rocks: measurement and significance, in Naeser, N.D., and T.H. McCulloh, eds., Thermal History of Sedimentary Basins: New York, Springer- Verlag. Bodner, D. P., and J.M. Sharp, 1988, Temperature variations in south Texas subsurface: American Association of Petroleum Geologists Bulletin, v. 72, no. 1, p. 21-32. Ewing, T. and R. Flores, 1991, Principal structural features of the Gulf of Mexico basin, in Salvador, A., ed., The Gulf of Mexico Basin: The Geology of North America, v. J: Geological Society of America, Boulder, Colorado. Ewing, T. E., 1991, Structural framework, in Salvador, A., ed., The Gulf of Mexico Basin: The Geology of North America, v. J: Geological Society of America, Boulder, Colorado. Gretener, P., 1981, Geothermics: Using temperature in hydrocarbon exploration: AAPG Education Course Note Series #17. Hunt, J. M., 1996, Petroleum Geochemistry and Geology, 2nd Ed.:, Freeman, San Francisco. Jones, K.O., and S. Nagihara, 2003, Sedimentary thermal maturation models for the deepwater eastern Gulf of Mexico: Transactions, GCAGS, v. 53, p. 374-383. Jones, M.L., S. Nagihara, and M.A. Smith, 2003, The regional geothermal heat flow regime of the north-central Gulf of Mexico continental slope: Transactions, GCAGS, v. 53, p. 363-373. Jones, P. H., 1969, Hydrodynamics of geopressure in the northern Gulf of Mexico basin: Journal of Petroleum Technology, v. 21, p. 803-810. Kumar, M. B., 1989, Geothermal patterns of Louisiana salt domes: Transactions, GCAGS, v. 39, p. 159-170. Leftwich, J. T., 1993, The development of zones of “undercompacted” shale relative to abnormal subsurface pressures in sedimentary basins: Unpublished PhD dissertation, Pennsylvania State University, Department of Geosciences. Lewis, C. R., and S.C. Rose, 1970, A theory relating high temperatures and overpressures: Journal of Petroleum Technology, v. 22, p. 11-16. Mello, U.T., and G.D. Karner, 1996, Development of sediment overpressure and its effect on thermal maturation: application to the Gulf of Mexico basin: AAPG Bulletin, v. 80, p. 1367-1396. Minerals Management Service, 2001, Atlas of Northern Gulf of Mexico Gas and Oil Sands: Minerals Management Service, U. S. Dept. of the Interior, New Orleans. Winker, C.D., 1982, Cenozoic shelf margins, northwestern Gulf of Mexico: Transactions, GCAGS, v. 32, p. 427-448. Worrall, D.M., and S. Snelson, 1989, Evolution of the northern Gulf of Mexico, with emphasis on Cenozoic growth faulting and the role of salt, in Bally, A.W., and A.R. Palmer, eds., The Geology of North America – An Overview: Geological Society of America, The Geology of North America, v. A., Boulder, Colorado. |


 (1)
(1) 
 ........
(2)
........
(2) 