 Click to view presentation in PDF format.
GCFootprints in Seismic Data*
By
Surinder Sahai1 and Khalid Soofi2
Search and Discovery Article #40230 (2007)
Posted February 21, 2007
*Adapted from the Geophysical Corner column, prepared by the authors, in AAPG Explorer, January, 2007. Editor of Geophysical Corner is Bob A. Hardage. Managing Editor of AAPG Explorer is Vern Stefanic; Larry Nation is Communications Director.
1Associate professor, Oklahoma State University, Stillwater, Oklahoma ([email protected])
2Senior research fellow, ConocoPhillips, Houston, Texas
The term
“![]() acquisition
acquisition![]() footprint” is often used to describe amplitude stripes that appear
in time slices or horizon slices produced from
footprint” is often used to describe amplitude stripes that appear
in time slices or horizon slices produced from ![]() 3-D
3-D![]() seismic data volumes.
Although
seismic data volumes.
Although ![]() acquisition
acquisition![]()
![]() design
design![]() of a
of a ![]() 3-D
3-D![]()
![]() survey
survey![]() has a major influence on the nature
and severity of a footprint, improper data processing techniques – such as the
use of incorrect normal moveout (NMO) velocities – can also create footprints.
has a major influence on the nature
and severity of a footprint, improper data processing techniques – such as the
use of incorrect normal moveout (NMO) velocities – can also create footprints.
This article
discusses the effect of ![]() survey
survey![]()
![]() design
design![]() on footprints and illustrates what can be
done to mitigate footprint effects at the interpretation stage.
on footprints and illustrates what can be
done to mitigate footprint effects at the interpretation stage.
uGeneral statementuFigure captionsuExampleuSummary
uGeneral statementuFigure captionsuExampleuSummary
uGeneral statementuFigure captionsuExampleuSummary
uGeneral statementuFigure captionsuExampleuSummary
|
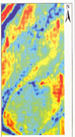
Figure 1a is a
time slice extracted from an onshore In this case it is easy to surmise that the
footprint tends to mimic the Zig-zag geometry is another common Figure 1b is a
time slice of data acquired with a mirror zig-zag pattern across an area
adjacent to the orthogonal
Any data-
A comparison of
Figure 2 with Figure 1b illustrates this
point: For the mirrored zig-zag In this data volume, a footprint is absent at a shallower depth (Figure 1b), then appears at a deeper depth (Figure 2a), and then disappears again at yet a deeper depth (Figure 2b). Other factors can modify an In many cases, such as the example in Figure 2a, an interpreter can look past the footprints and do a good job of inferring the geology. In other instances, the footprint may be so severe that it masks important information about the geology. In Figure 1a, for example, the presence of a channel in the image’s northeast corner is completely masked by the footprint. A properly designed filter applied in the frequency-wave number domain can reduce the vertical and horizontal stripes in the time slice and make it easier to see the channel (Figure 3). Some interpretation workstations provide the
capability to
Summary
In
summary, we should attempt to minimize footprints by employing proper
seismic
|

