 Click to view article in PDF format.
Stochastic Monte-Carlo simulations of overpressure probability distribution in the Halten Terrace area*
By
Ane Lothe1 and Are Tømmerås1
Search and Discovery Article #40232 (2007)
Posted February 11, 2007
*Adapted from extended abstract prepared for presentation at AAPG 2006 International Conference and Exhibition, Perth, Australia, November 5-8, 2006
1SINTEF Petroleum Research, S.P. Andersens vei 15B, N-7465 Trondheim, Norway
Quantifying the uncertainties in pore pressure simulations at basin scale is a challenge. This is mainly because the geological processes that control pressure generation and dissipation and the lateral fluid flow in a sedimentary basin are still not well understood. Stochastic Monte-Carlo simulation of overpressures is an approach that can be used to quantify the uncertainties related to some of the calculated processes. The technique presented here can provide important guidelines when planning drilling operations in new parts of a basin.
Study Area and Regional Geology
The study area is located in the Halten Terrace, offshore Mid-Norway (Figure 1). The Halten Terrace is highly block-faulted, due to major extensional activity during the Late Jurassic to Early Cretaceous (Blystad et al., 1995). The Halten Terrace area has undergone continuous subsidence since Paleozoic. The subsidence history suggests moderate to high sedimentation rates during the Mesozoic and very high rates in the Late Pleistocene (Dalland et al., 1988). Today, the reservoir rocks (Garn Formation, Fangst Group) are buried to depths between 2.0 and 3.5 km in the western part of the terrace. The rapid, late burial led to increased pressure in the western part of the area. The pressure generation was highly influenced by increased quartz cementation in the Fangst Group.
|
|
The pressure simulator named PRESSIM is used to do the pressure modelling. The simulator is developed to calculate pressure build-up and dissipitation on geological time scale in sedimentary basins (Borge, 2000, Lothe, 2004; Figure 2). The fault traces mapped at the top reservoir level delineates the lateral extent of the pressure compartments that are used in the simulator. The lateral Darcy flow of formation water across low-permeable faults is calculated using an explicit forward Euler solution technique (Borge, 2000). Depth-converted maps of the overlying sediments are used to construct the burial history that is adjusted for decompaction. A porosity-depth relation in the shales is used to model mechanical compaction (Baldwin and Butler, 1995), and a kinetic model for quartz cementation (Walderhaug, 1996) is used to model chemical compaction of the sands. The geo-mechanical properties for the caprock are allowed to vary through time with changing burial depths (Lothe et al., 2004). Isotropic horizontal stresses are assumed, and the minimum horizontal stress is estimated using an empirical formula (Grauls, 1998). The vertical stress versus time varies depending on sedimentary loading and fault permeability; it is modelled as depth dependent. The fault transmissibility depends on the burial depth, the length, width, and the dip-slip displacement of the faults, thickness of the reservoir layers, and the permeability inside the fault block (Borge and Sylta, 1998). The Griffith-Coulomb failure criterion and the frictional sliding criterion are used to simulate hydraulic fracturing from the overpressured compartments. Depth maps of the different stratigraphic units were used to compute the decompacted subsidence history for the Jurassic Garn Formation for the time steps: 90, 80, 65, 20, 5, 2 Ma and today. The fault trace map of the top Garn Formation was used to divide the reservoir into pressure compartments.
As outlined in Krogstad and Sylta (1996), Sylta and Krogstad (2003) and Sylta (2004), hydrocarbon 3D basin simulations can be carried out with Monte Carlo simulation loop. The same methods can be used to simulate pressure versus depth in wells. Sylta and Krogstad (2003) assumes, built on the study from 1996, that at least 1000 runs are required in each applications to make reliable fluid flow predictions. This is because fluid flow is a non-linear problem to solve. Sylta and Krogstad (2003) used a probabilistic description of the key input parameters; e.g., thickness of source rock unit as the sum of a) a map grid of the most likely values and b) a standard deviation from the most likely values. This can also be used in our case, where the most important input variables can be described with a probability distribution. The calibration of the model consists of finding a set of input variables and their values that result in a match to present-day pressures and minimum horizontal stresses versus depth in wells. The input values that are varied in the stochastic simulations are listed in Table 1. The simulation results can be weighted, depending on the measured pressures and stresses in wells. Each simulation run is weighted accordingly to match the calibrated wells, using the equation from Sylta and Krogstad (2003) rewritten to:
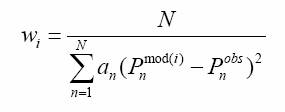
where wi is the weight of simulation run number ‘i’, N is the total number of calibration depths, an is a weight of importance of applied to each calibration depth, ‘n’ refers to well depth , Pn mod(i) is the modelled overpressure for depth ‘n’ in run ‘i’ , and Pn obs is the measured (observed) overpressures for calibration well for depth ‘n’. When the average difference between the modelled and measured overpressures increases, the weight of the simulations will decrease. An estimator for the most likely predicted pressure is (rewritten from Sylta and Krogstad, 2003):
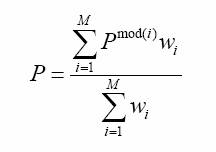
where ‘M’ is the total number of simulations runs used.
To assess the uncertainties, more than 3000 runs with stochastic Monte-Carlo approach has been carried out. First, the results for the Monte-Carlo simulations where analysed without using any knowledge of the pressure distribution and magnitude in the area. As may be expected, a large uncertainty was observed for the simulated pressures. For the Kristin field (Figure 1), mean simulated overpressure was 485 +/- 45 bar (measured overpressure is 433 bar). Also for Presidenten, large uncertainties are simulated, with a mean overpressure of 383 +/- 47 bar (measured overpressure is 326 bar; Figures 1 and 3). Secondly, we weighted simulated Monte-Carlo results versus measured pressures in wells. The results were weighted 100% versus two wells (6406/2-3 [Kristin field] and 6406/2-6 [Lavrans field]) and 20% weighting to 14 wells. Pressure probability estimates in certain compartments are shown; e.g., present-day overpressure in the Kristin Field is estimated to be 428 +/-3 MPa (measured is 433 bar). The results for Kristin are, as expected, excellent as this well was used for weighting the results. Yet, the results for Presidenten also are very good, with match within the uncertainty range (Figure 4).
Monte-Carlo simulations can be a very useful tool to predict and quantify uncertainties in pressure simulations on a basin scale. Probability maps that show the calculated uncertainty of the pressures in different parts of the basin can be used for planning of future exploration wells.
Baldwin, B., and C.O. Butler, 1985, Compaction curves: AAPG Bulletin, v. 69, no. 4, p. 622-662. Blystad, P., et al., 1995, Structural elements of the Norwegian continental shelf, Part II. The Norwegian Sea Region: Norwegian Petroleum Directorate Bulletin, v. 8. Borge, H., 2000, Fault controlled pressure modelling in sedimentary basins, in Department of Mathematical Sciences: Norwegian University of Science and Technology, Trondheim. p. 148. Borge, H., and Ø. Sylta, 1998, 3D modelling of fault bounded pressure compartments in the North Viking Graben: Energy, Exploration and Exploitation, v. 16, p. 301-323. Dallmann, W.K., 1998, The structure of the Berzeliustinden area: Evidence for thrust wedge tectonics in the Tertiary fold-and-thrust belt of Spitsbergen: Polar Research, v. 6, p. 141-154. Grauls, D., 1998, Overpressure assessment using a minimum principal stress approach. in Overpressures in petroleum exploration; Proc. Workshop: Bull. Centre Rech. Elf Explor. Prod., Pau, France. Krogstad, W., and Ø. Sylta, 1996, Risk assessment using volumetrics from secondary migration modelling: Aassessing uncertainties in source rock yields and trapped hydrocarbons, in Quantification and Prediction of Petroleum Resources, A.G. Dore and R. Sinding-Larsen, eds., Elsevier: Amsterdam. p. 219-235. Lothe, A. E., 2004, Simulations of hydraulic fracturing and leakage in sedimentary basins: Ph.D. dissertation, 2004, University of Bergen, p.184. Lothe, A.E., H. Borge, and R.H. Gabrielsen, 2004, Modelling of hydraulic leakage by pressure and stress simulations: An example from the Halten Terrace area, offshore Mid-Norway: Petroleum Geoscience, v. 10, no. 3, p. 199-213. Sylta, Ø., 2004, A probabilistic approach to improved geological knowledge and reduced exploration risks using hydrocarbon migration modeling: Petroleum Geoscience, v. 10, p. 187-198. Sylta, Ø., and W. Krokstad, 2003, Estimation of oil and gas column heights in prospects using probabilistic basin modelling methods: Petroleum Geoscience, v. 9, p. 243-254. Walderhaug, O., 1996, Kinetic modelling of quartz cementation and porosity loss in deeply buried sandstone reservoirs: AAPG Bulletin, v. 89, no. 5, p. 731-745.
|

