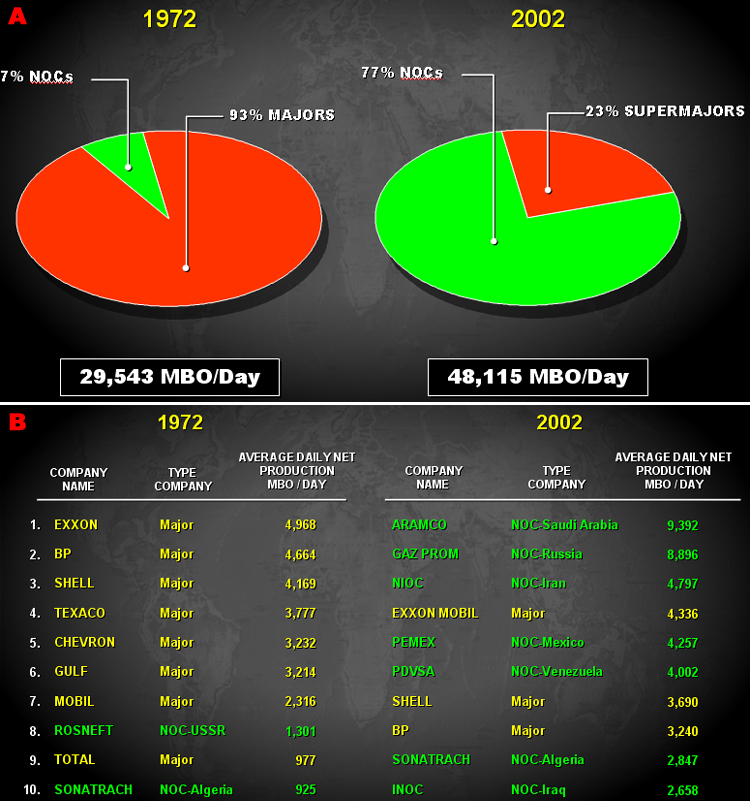
Figure 3. Daily oil production of top ten global producers, 1972 and 2002. A. Diagram of majors or supermajors vs. NOCs. B. Table of top ten global producers, 1972 and 2002.
Figure 3. Daily oil production of top ten global producers, 1972 and 2002. A. Diagram of majors or supermajors vs. NOCs. B. Table of top ten global producers, 1972 and 2002.