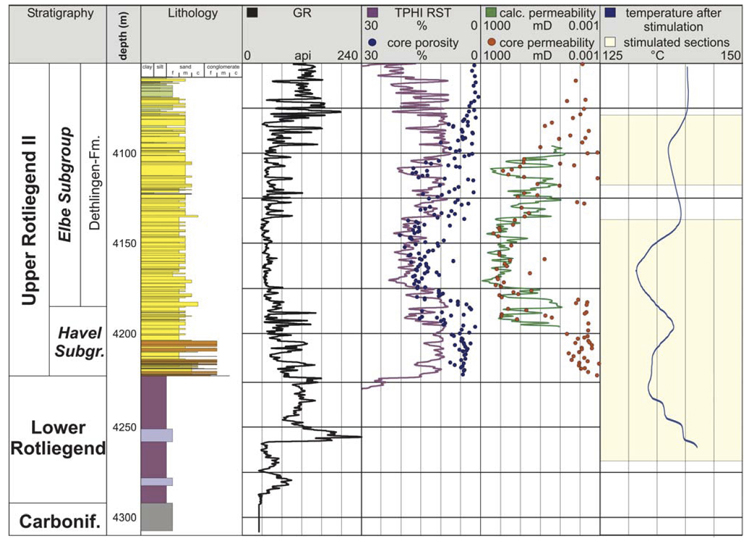
Figure 4. Lithostratigraphic chart of the siliciclastic Rotliegend strata in the well Gross Schönebeck 3/90 and comparison of logging data (Tphi RST) with measured core porosities as well as calculated permeabilities (logarithmic scale) with core permeabilities (porosity: n = 290; permeability: n = 109). The right track illustrates a borehole temperature measurement after stimulation. Bright yellow areas show the stimulated intervals.