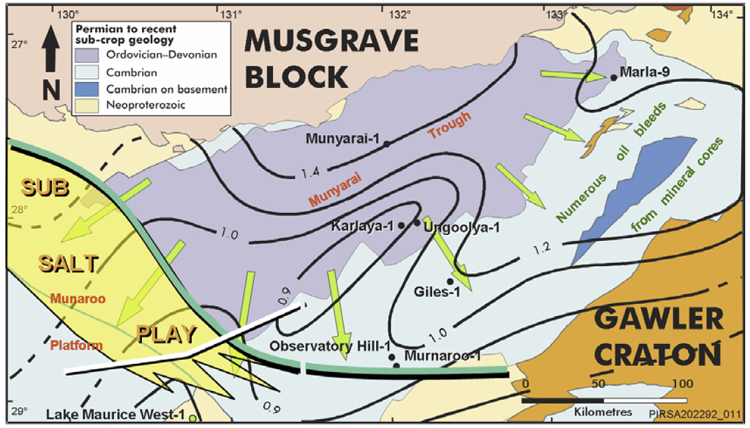
Figure 2: Location of the sub-salt play in the eastern Officer Basin - overlain on a Permian to recent subcrop map. White line is location of seismic in Figure 3, black lines are Neoproterozoic aromatic maturity vitrinite reflectance contours calculated from methylphenanthrene index (after Gravestock & Hill 1997), thick green line is Birksgate-Coober Pedy structural corridor, green arrows are migration pathways.