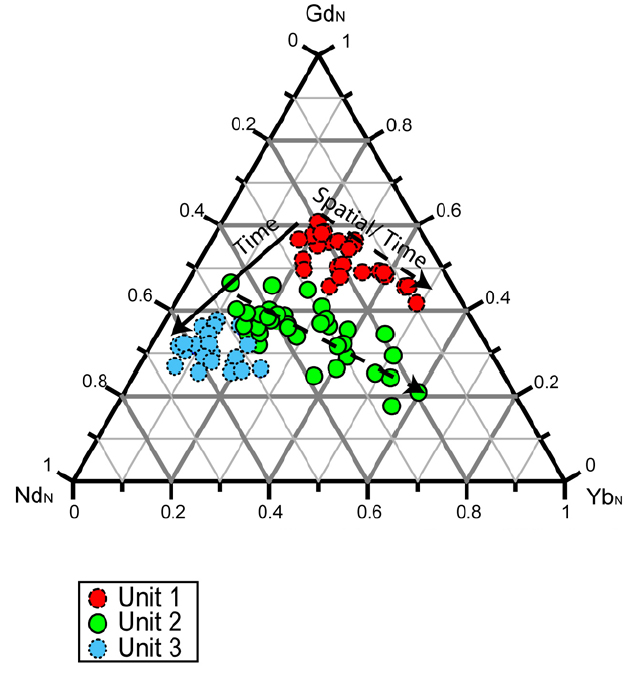
Figure 6. Ternary Diagram. REE ratios of bones vary stratigraphically. Geochemistry of the bones changes toward LREE-enrichment over time (solid arrow). Bones in unit 1 and 2 show a trend toward HREE-enrichment. This is likely a record of the evolution of groundwater along its flowpath at the time of fossilization and then subsequent spatial reworking. This evolution is due to adsorption/desorption of REE (Dia et al., 2000). Subscript “N” indicates normalization (Gromet et al., 1984).