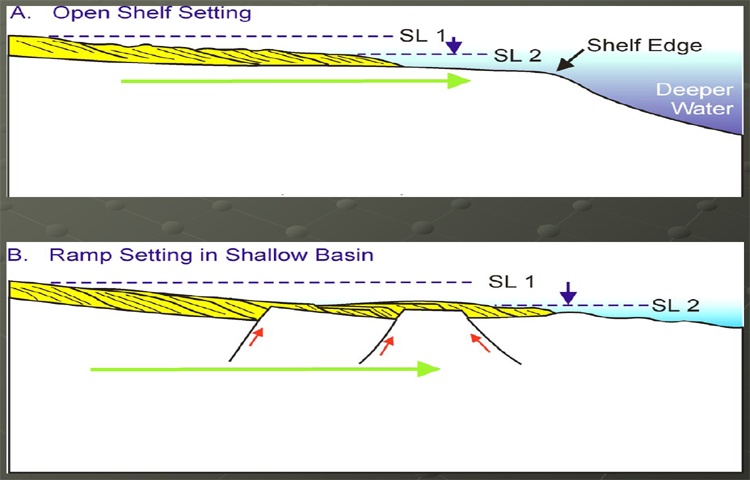
Figure 10. Schematic sections illustrating changes in influence of processes with changes in relative sea level: A. Open shelf setting. B. Ramp setting in shallow basin).
Figure 10. Schematic sections illustrating changes in influence of processes with changes in relative sea level: A. Open shelf setting. B. Ramp setting in shallow basin).