Click on image for enlargement.
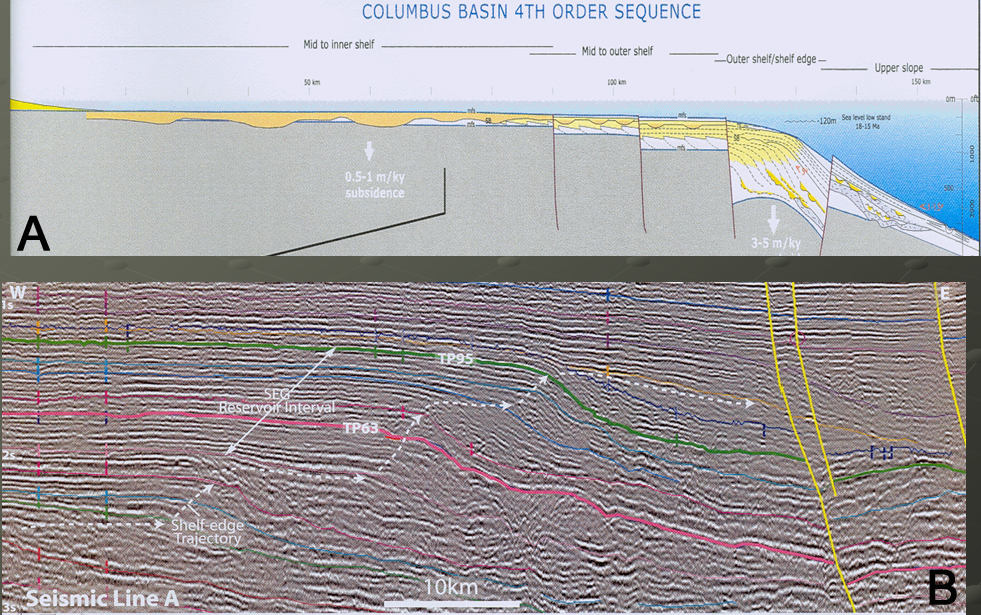
Figure 7.
A. Cross-section, Columbus basin: 4th order
sequence between maximum flooding surfaces below and above sand-rich interval
defined by a basal unconformity (58) (from Sydow et al., 2003, with kind
permission of GCSSEPM Foundation, Norman C. Rosen, Executive Director). Interval
demonstrates growth across faults, with the largest at or near the shelf edge.
B. Seismic Line A, East Venezuela shelf / Columbus basin (location in Figure 8):
shelf-edge trajectory of the SEG reservoir interval shows lateral (progradation)
and vertical (aggradation) components (from Sydow et al., 2003,
with kind permission of GCSSEPM Foundation, Norman C. Rosen, Executive
Director).