|
Figure and Table Captions
Return to top.
This report was prepared as an account of work sponsored by an agency of
the United States Government. Neither the United States The views and
opinions of authors expressed herein do not necessarily state or reflect
those of the United States Government or any agency thereof.
Organic matter in the Devonian gas shales has large surface areas
similar to that found in coal. Coal seams are currently being
investigated as potential sequestering sites for CO2, the
most important greenhouse gas [1]. Naturally occurring organic matter (kerogen)
is a microporous material that possesses a very high surface area and
hence sorption capacity for gas. The question is: can Devonian gas
shales adsorb sufficient amounts of CO2, that they might be
significant targets for CO2 sequestration?
The study area is primarily confined to the major gas-producing area of
the Ohio Shale in the Big Sandy Gas Field, eastern Kentucky (Figure 1,
main concentration of producing localities). As key wells and available
samples are identified, wells in deep (at least 1,000 feet) and thick
(at least 50 feet) areas will be included. Two Illinois Basin wells have
also been sampled. Battelle has contributed drill cuttings through the
Devonian shale from their deep AEP CO2 seqestration project
well in Mason County, W. Va.
The Ohio Shale is subdivided into seven recognizable units: Cleveland
Shale, Three Lick Bed, Upper, Middle, and Lower Huron, Olentangy, and
Rhinestreet. The Olentangy and Rhinestreet black shales correspond to
the Java  Formation Formation of West Virginia, and thin and pinch out westward. A
summary of reservoir data for the Big Sandy Gas Field is available in
the "Atlas of Major Appalachian Gas Plays" [2]. Figure 2 shows is a west
to east cross section sub-parallel to regional dip through the Big Sandy
Gas Field that illustrates an eastward pinchout of the Cleveland and
Upper Huron carbonaceous shale units into the gray Chagrin shale
equivalents. The average completed interval exceeds 500 feet in
thickness. Average porosity is 4.3 percent, with a maximum of 11
percent. Reservoir temperature averages 84°F, with an initial reservoir
pressure of 800 psi or more. Current reservoir pressure averages 400 psi.
Limited permeability data are available, but indicate less than 0.1
millidarcy of matrix permeability. Fracture permeability may exceed
several hundred millidarcies. of West Virginia, and thin and pinch out westward. A
summary of reservoir data for the Big Sandy Gas Field is available in
the "Atlas of Major Appalachian Gas Plays" [2]. Figure 2 shows is a west
to east cross section sub-parallel to regional dip through the Big Sandy
Gas Field that illustrates an eastward pinchout of the Cleveland and
Upper Huron carbonaceous shale units into the gray Chagrin shale
equivalents. The average completed interval exceeds 500 feet in
thickness. Average porosity is 4.3 percent, with a maximum of 11
percent. Reservoir temperature averages 84°F, with an initial reservoir
pressure of 800 psi or more. Current reservoir pressure averages 400 psi.
Limited permeability data are available, but indicate less than 0.1
millidarcy of matrix permeability. Fracture permeability may exceed
several hundred millidarcies.
Methods
Drill cuttings on file at the Kentucky Geological Survey Well Sample and
Core Library and sidewall cores are the main source of material for
analysis. Unwashed sets of recently acquired drill cuttings were used to
minimize weathering of material and to maximize volume of material for
analysis.
To investigate any relation between organic content and CO2
sorption capacity, total organic carbon content (TOC) was determined.
For total organic carbon analyses, duplicate sample splits were crushed
to a maximum particle size of 200 microns (–60 mesh): one split was run
“as is;” another split was treated with 30 percent hydrochloric acid (HCl)
for 12 to 24 hours to remove any carbonate minerals from the matrix.
To measure thermal maturity, mean random reflectance on dispersed
vitrinite particles in the samples was determined on a Zeiss USMP
incident light microscope calibrated using glass standards of known
reflectance. Maximum vitrinite reflectance values can be estimated by
multiplying the mean random measurements by 1.066 [3].
Adsorption analyses were performed using a high-pressure volumetric
adsorption technique similar to that described by Mavor et al. [4].
Isotherms were measured on a custom-made apparatus. A known volume of
gas within a reference cell is used to dose a sample cell. The amount of
gas adsorbed in the sample cell is then determined, based on a change in
pressure in the sample cell using the Real Gas Law (Peng Robinson
equation of state). Following dosing of the sample cell, the pressure
drops until equilibrium is reached. When equilibrium is reached, the
sample is dosed at a higher pressure. Typically, 11 separate pressure
points are selected and measured so that a Langmuir regression curve can
be accurately generated. The reported CO2 sorption capacity
and corresponding pressure are calculated coefficients of the Langmuir
model and are used to determine the sorption capacity at
reservoir-appropriate pressures.
Schmoker [5] suggests a method to compute total organic carbon content
from standard density logs acquired by the petroleum industry. The model
assumes the shale consists of three main components:
quartz-feldspar-mica, clay minerals, and organic matter. The density of
a shale then is primarily a function of the weight percent of organic
matter.
Laboratory investigation of methane displacement in the presence of CO2
is being performed on whole rock core samples. In cooperation with
Columbia Natural Resources, access to a well in Knott County, eastern
Kentucky, was obtained for logging and collection of sidewall cores. The
sidewall core plugs are being saturated with methane and will subjected
to simulated injection of CO2. Laboratory setup and analyses
are similar to the standard procedure for obtaining adsorption
isotherms. Additional sidewall core samples and an ECS log have recently
been acquired from an Interstate Natural Gas well in Martin County,
eastern Kentucky.
Twenty-six samples have been collected from seven wells, including
sidewall cores and electron capture spectroscopy and lithodensity logs
from the Columbia Natural Resources No. 24752 Elkhorn Coal Corporation
well in Knott County and the Interstate Natural Gas No. 3 John Jude
Heirs well in Martin County. The New Albany shale has been sampled in
two wells in Indiana and the Lower Huron has been sampled in the
Battelle No. 1 AEP (Mountaineer power plant) in West Virginia. Data for
completed analyses are presented in Table 1.
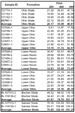
Adsorption isotherms for these samples are presented in Figure 3. The
Langmuir volume and pressure data reported in Table 1 must be compared
on a uniform pressure basis by formation. These summary data are shown
in Table 2. A cross plot of the observed TOC and the gas storage volume
at a specified pressure (400 psia) is shown in Figure 4. This linear
relationship can be used to calculate CO2 storage capacity
from TOC data. Figure 5 is a cross plot of gamma-ray and density data
from one well. The cross plot demonstrates the model proposed by
Schmoker [5]. The most clastic units (in this case, the Berea overlying
the Ohio Shale) are in a cluster below 150 API gamma-ray units and
between densities of 2.5 and 2.8 grams per cubic centimeter (g/cm3).
Gray shales cluster generally above 150 API gamma-ray units at densities
between 2.6 and 2.8 g/cm3. Black shales tend to vary between
150 and 450 API gamma-ray units and densities between 2.3 and 2.7 g/cm3.
Using Schmoker’s method to estimate TOC from density logs and the
relation between TOC and CO2 storage capacity, CO2
storage is being estimated from density log data. Correlation between CO2
capacity from isotherms and that calculated from density logs is being
tested.
Initial estimates of CO2 sequestration capacity have been
calculated using selected data. The sequestration volume of the Lower
Huron was estimated using areal distribution and thickness data from
Dillman and Ettensohn [9] and indicate 91 x 1012 cubic feet (2.6 x 10¹²
cubic meters) of CO2 could be sequestered in the Lower Huron.
Assuming 30 percent of this theoretical saturation, approximately 1.6
billion tons (1.5 billion metric tonnes) of CO2 could be
sequestered. Using a GIS technique, estimated initial CO2
sequestration capacity of the Devonian shale in Kentucky is 27.7 billion
tons (25.1 billion metric tonnes) (Figure 6) in shale at least 1,000
feet deep and 50 feet thick.
Preliminary data indicate that black, organic-rich gas shales can serve
as targets for sequestration of significant volumes of anthropogenic CO2.
The more carbonaceous black shales are the most likely reservoirs and
the less organic gray shales may serve to seal the reservoirs. At
Kentucky's current rate of power plant emissions, the organic-rich,
black shale in the state could sequester more than 300 years' worth of
that carbon. Enhanced production of natural gas displaced by the
injected CO2 would contribute to a long-term increase in the
supply of that resource.
This research is sponsored by the National Energy Technology Laboratory,
U.S. Department of Energy, contract DE-FC26-02NT41442.
1. IEA Coal Research, 1999, CO2
reduction—Prospects for coal. London, IEA Coal Research, 84 p.
2. Boswell, R., 1996, Play Uds: Upper Devonian black
shales, in Roen, J.B. and B.J. Walker, eds. Atlas of Major
Appalachian gas plays. West Virginia Geologic and Economic Survey,
Publication V-25, p. 93–99.
3. Ting, F.T.C., 1978, Petrographic Techniques in Coal
Analysis, in Karr, C., Jr. (ed). Analytical Methods for Coal and
Coal Products. Academic Press, v. 1, pp. 3-26.
4. Mavor, M.J., L.B. Owen, and T.J. Pratt, 1990,
Measurement and evaluation of isotherm data. Proceedings of the 65th
Annual Technical Conference and Exhibition of the Society of Petroleum
Engineers, SPE 20728, p. 157-170.
5. Schmoker, J. W., 1993, Use of formation-density logs
to determine organic-carbon content in Devonian shales of the western
Appalachian Basin and an additional example based on the Bakken
Formation of the Williston Basin, in J. B. Roen, and R. C.
Kepferle, eds. Petroleum geology of the Devonian and Mississippian black
shale of eastern North America. U. S. Geological Survey Bulletin 1909,
U.S. Government Printing Office, p. J1-J14.
Return to top.
|