![]() Click
to article in PDF format.
Click
to article in PDF format.
GCGravity Data: Lot of Bang for Buck*
By
G. Randy Keller1
Search and Discovery Article #40178 (2005)
Posted December 20, 2005
*Adapted from the Geophysical Corner column, prepared by the author, in AAPG Explorer, August, 2005. Appreciation is expressed to Alistair Brown, editor of Geophysical Corner, and to Larry Nation, AAPG Communications Director, for their support of this online version.
1University of Texas at El Paso ([email protected])
|
|
Gravity measurements are a simple and inexpensive source of information about the subsurface structure of an exploration target. These data require only some simple data reduction to be converted into interpretable anomaly values.
By “anomaly,” we
mean departures from values that can be calculated for a simple model of the
Earth, including compensation for the variations in gravity due to measurements
being made at different elevations. The overall gravity We often find anomalies of a few milligals to be geologically significant, and the effect of changes in elevation alone is about 0.3 milligal/meter. Thus, a crucial consideration in gravity surveys is the measurement of the elevation where the measurement is made. In the case of land surveys, determining the elevation to an accuracy of a few centimeters involves a larger effort than making the actual gravity readings. Because of the large effects topography has on gravity measurements, correcting for these effects in mountainous regions poses a special challenge. However, the broad availability of digital elevation models worldwide, thanks to efforts such as the Shuttle Radar Topography Mission, and the ability of computers to handle massive data sets have brought this problem under control.
The specific type
of anomaly that is usually employed in gravity studies is the Bouguer anomaly,
which is called the Complete Bouguer anomaly if the reduction process includes
terrain
Given geologic constraints, drill hole data and supporting geophysical data, this ambiguity can be drastically reduced. Thus, these data are particularly useful in:
Classic applications of gravity data that define prospects directly include:
If one has a good geologic understanding of an area, the qualitative interpretation of gravity data is in fact quite straightforward. The key is thinking about density contrasts -- sediments (2.5 gm/cm3) versus basement (2.7 gm/cm3) -- that would produce a particular anomaly. For example, a gravity high could be due to a structural uplift that has brought denser (older and more compacted or cemented) rocks near the surface, and a gravity low could be due to a sedimentary basin that contains rocks less dense than the surrounding geology. Two-dimensional models are a more quantitative form of interpretation and should be derived in much the same way as the construction of a geologic cross-section in that the process should involve integration of all available information. Three-dimensional modeling also is often undertaken. Gravity studies often begin with public domain regional scale data sets consisting of point measurements taken on land, track data recorded from ships or aircraft, or even data derived from satellites. Land and marine measurements recently have been compiled into a large database for the contiguous United States, and a North American database effort is well under way. These databases are the result of a cooperative effort by the U.S. Geological Survey, the National Geospatial-Intelligence Agency, NOAA/NGS (National Oceanic and Atmospheric Administration / National Geodetic Survey) and university groups.
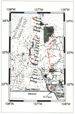
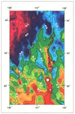
The current version of this database can be accessed at http://paces.geo.utep.edu, and an example of the data is available for the southern Rio Grande rift region (Figure 1). The Rio Grande rift is a major continental rift zone that is associated with a series of deep basins that both follow and cut across older features. The data shown in Figure 1 were gridded and contoured to produce the Bouguer anomaly map shown as Figure 2. This map is dominated by a strong regional increase of anomaly values (~100 milligals) from northwest to southeast that obscures the more local anomalies due to the basins.
This regional
anomaly is primarily due to the crustal thinning across the Rio Grande rift and
to a batholith that is found beneath the Datil-Mogollon volcanic
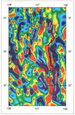
In
Figure 3, the regional The map’s southern portion shows strong northwest trends that reflect Laramide uplifts.
Any gridding and contouring software can be used to turn the gravity measurements at points into maps.
|