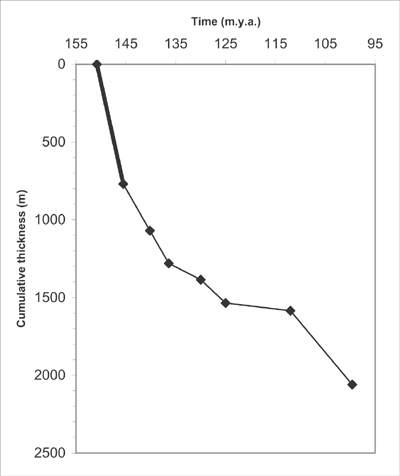
Fig. 2. Accumulation history plot for study area (Tithonian to Albian), southern part of the Dinaric platform. Tithonian portion of subsidence curve is shown by heavy line.
Fig. 2. Accumulation history plot for study area (Tithonian to Albian), southern part of the Dinaric platform. Tithonian portion of subsidence curve is shown by heavy line.