![]() Click
to article in PDF format.
Click
to article in PDF format.
GCHorizon Attribute Curvature Aids Stratigraphic Interpretation*
By
Bruce S. Hart1 and Justine A. Sagan1
Search and Discovery Article #40172 (2005)
Posted November 7, 2005
*Adapted from the Geophysical Corner column, prepared by the authors and entitled “Curvature Helps Strat Interpretation,” in AAPG Explorer, February, 2005. Appreciation is expressed to Alistair Brown, editor of Geophysical Corner, and to Larry Nation, AAPG Communications Director, for their support of this online version.
1McGill Seismic Research Group, McGill University, Montreal, Canada. ([email protected]).
|
|
Horizon attributes (such as
Many
different types of curvature may be defined for a surface that is curved
(Figure 1). For example, curvature
may be defined in the strike (KS), Curvature analysis has been used in terrain sciences for various purposes, including the definition of drainage networks. In the late 1990s, Andy Roberts (then with Enterprise Oil) illustrated how curvature could be used to define subtle structures that compartmentalize reservoirs in a field from the North Sea.
Horizontal Attributes in Defining Depositional Features With this column we illustrate the use of horizon attributes to help define depositional features in 3-D seismic volumes from clastic and carbonate environments. We developed freeware that allows us to change the wavelength over which the curvature is calculated.
Curvature
analysis of surfaces helps to remove the effects of regional
In the
examples here we illustrate
Illumination angles were adjusted to further highlight features of
interest. Ideally, viewing
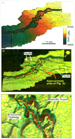
Figure 2a shows a time-structure map of the top of a Tertiary
channel-levee complex from a deep-water setting. The axis of the channel
is clearly evident, as is a regional
Note how
the curvature visualization displays better define the faults, as well
as details of the morphology within the channel itself. It is clear that
the channel margins have been enlarged by meander loop migration. An
erosional inner thalweg was subsequently cut, at least locally. Faults
are clearly visible outside of the channel. Comparison of
Figures 2b and
2c shows how changing the viewing
Figure 3a shows a time-structure map of a Devonian horizon from the
Williston Basin. The image shows a regional
The broad
aperture we used in this example helps to emphasize the flanks of the
pinnacles. This particular viewing Curvature is calculated from regularly sampled surfaces, such as horizons picked in 3-D seismic data. Digital elevation model data, swath bathymetry and even potential field data such as aeromagnetic data also may be used in curvature analyses. Point-based data (e.g., well tops) or horizons picked in 2-D seismic lines also may be analyzed using curvature—however, these data need to be gridded before analysis, and the results are highly sensitive to the gridding method used and input data density (i.e., small-scale features are poorly defined). As a cautionary note we emphasize that, however helpful curvature-based visualization may be, seismic interpreters need to go beyond simple horizon-based analyses. This is because some morphologies can be formed by more than one process. Vertical transects through 3-D volumes need to be examined to help determine the origin of features identified through curvature analysis. The software used to derive the curvature attributes, including curvature of different apertures, was developed during a Department of Energy funded project on naturally fractured tight-gas reservoirs and is freely available at http://www.eps.mcgill.ca/~hart/CURVZ_website.htm. |