![]() Click
to view presentation in PDF format (37MB).
Click
to view presentation in PDF format (37MB).
Recommend--download to hard drive
Images in sequence of 12 PDF files
Recommend--online viewing
The Sun / Earth ![]() Climate
Climate![]() System: A Geoscience
Perspective*
System: A Geoscience
Perspective*
By
Arthur R. Green1
Search and Discovery Article #70014 (2005)
Posted May 19, 2005
*Adapted from 2004-2005 AAPG Distinguished Lecture; Funded by the AAPG Foundation through the J. Ben Carsey Endowment. Illustrations by Dolores Claxton.
1Chief Geoscientist, ExxonMobil Exploration Company, Houston, TX, Retired; current address: Gig Harbor, WA ([email protected])
|
|
Conclusions
Scientific Methods and ContextFigures 1-3
Reports of the U.S. National Research Council Natural Academy of Science (Figure 1)
The solar-terrestrial connections: Space weather--Selected publications (Figure 2)
Toward a Synthesis of the Newtonian and Darwinian World Views
Physicists seek simplicity in universal laws that create and control
PhysicsThe more you look, the simpler it gets. Universal patterns, search for laws. Predictive (chaos and quantum mechanics notwithstanding). Central role for ideal systems (ideal gas, harmonic oscillator).
EcologyThe more you look, the more complex it gets. Weak trends; reluctance to seek laws. Mostly descriptive; explanatory. Disdain for caricatures of nature / analogs.
“I have witnessed the dysfunctional consequences of this bimodal legacy," Dr. John Harte (particle physicist), Energy Resource Group, University of California, Berkeley.
To complicate the biomodal thinking of physicists and earth systems scientists, economists follow preferred economic models; geopoliticians and nations follow trends of perception; and the layman follows______?
|


|
|
|
|
|
Figure 5. Solar radiation. Sunspot number from 1610 to 1970 and solar total irradiance from 1600 to 2000 (upper right) (after Lean et al., 1995; Pang and Yau, 2002, with permission of American Geophysical Union). Total solar magnetic flux emanating from the sun from 1875 to 1990 (lower right) (from Lockwood et al., 1999, with permission of Nature -- http://www.nature.com/help/reprints_and_permissions/permit_form.html). |
|
|
|
|
|
|
|
|
|
|
|
Figure 9. Celestial driver of Phanerozoic |
|
|
Figure 10. Milankovitch |
|
|
Figure 11. Milankovitch |
|
|


Itemization of External Mechanisms
Solar radiation and galactic forcing - an emerging science
Sunspot variation and irradiance changes - directly affects temperature
Solar ultraviolet wavelength variability - affects ozone production and upper atmosphere winds
Magnetic variation - affects rainfall and cloud cover, at least partially, through control of the earth's electrical field
Celestial influence?
Earth's
orbital changes - linear ![]() cycles
cycles![]() within a non-linear system
within a non-linear system
Eccentricity - rotation }
Obliquity (tilt) } Milankovitch ![]() Cycles
Cycles![]() 19-23 K, 1 K
& 100-400 K
19-23 K, 1 K
& 100-400 K
Precession of equinoxes }
Asteroid impacts - creates dust clouds and tidal waves
Aerosols - blockage of sun's radiation
Extinction
The Moon
Gravity deflections
Earth and ocean tides - interaction with Coriolis force
Biological rhythms
Solar Radiation and Galactic Forcing
Sunspot variation and irradiance changes
Solar ultraviolet wavelength variability
Magnetic variation
Celestial influence?
Comments on External Mechanisms (Figures 4, 5, 6, 7, 8, 9, 10, 11, and 12)
The Sun (Figure 4)
The diameter of the sun is 864,000 miles. Hydrogen and helium compose 95% of it. Energy is generated by thermonuclear fusion that converts hydrogen to helium. Solar flairs hurl radiation and particles into space. The plasma temperature is about 1million degrees. Bright region "sun spots" have higher density of coronal gas than dark regions.
Solar radiation - an emerging science (Figure 5)
Sunspot variation and irradiance changes directly affect temperature.
Magnetic variation affects rainfall and cloud cover, at least partially, through control of the earth's electrical field (Figure 6).
Earth's
orbital changes-linear ![]() cycles
cycles![]() within a non-linear system (Figures
10 and
11).
within a non-linear system (Figures
10 and
11).
Eccentricity - changes in the shape of the orbit about the sun
(100k-400k ![]() cycles
cycles![]() ).
).
Obliquity - tilt of the Earth (23 1/2o) (41k cycle) (illustrated with major atmosphere patterns by George R. Rumney, 1968).
Precession of equinoxes - the timing of the Earth's closest approach to the sun (19k-23k).
Asteroid impacts (Figure 12)- creates dust clouds and tidal waves and faunal and floral extinctions.
The moon - Earth tides and ocean currents.
Major climatic forcing mechanisms
of the Sun - Earth ![]() climate
climate![]() system
system
Internal
Itemization of Internal Mechanisms
Subsurface atmosphere
Atmosphere - involved in every physical process of potential importance
to abrupt ![]() climate
climate![]() change: temperature, humidity, cloudiness, wind.
change: temperature, humidity, cloudiness, wind.
Albedo (reflectance) - the ratio of reflected to incident radiation from the sun.
Atmosphere - water vapor is the largest greenhouse gas because it's molecules absorb along wavelengths.
Circulation cells and patterns - rapidly propagate the influence of any
![]() climate
climate![]() forcing from once part of the globe to another.
forcing from once part of the globe to another.
Gas composition – chemistry - carbon dioxide (CO2), methane (CH4), nitrous oxide (N2), halocarbons, troposphereic nitrogen oxides, carbon monoxide (CO), sulfate aerosols - city heat.
Greenhouse warming gases
Aerosols
Ocean-terrestrial-atmosphere feedback
Internal oscillation zones
Hydrosphere - water is fundamental to creating and regulating the
earth's ![]() climate
climate![]() .
.
Oceans - enormous heat capacity, to store and transfer heat in 3 dimensions.
Thermohaline circulation - a major long term regulator of temperature - a switch?
Internal dynamics (El Niño) - a 2-3 year heating event that sets weather patterns.
Lakes - overturning, moisture, areal extent, outburst floods.
River systems
Subsurface aquifers - facilitates biological processes (respiration and photosynthesis), physical processes (erosion), and chemical processes (dissolution and chemical weathering).
Carbon cycle
Biosphere - a key component in global biogeochemical cycling (storage
and release) of carbon, nutrients and other chemicals that influence
![]() climate
climate![]() .
.
Life forms (marine and terrestrial).
Carbon dioxide (biological pump) cycle - stores and releases CO2.
Methane - wetlands and animals.
Forests - O2 and albedo.
Anthropologic evolution - man, his works and products.
Cryosphere - polar ice is rare in the earth's history and generates a
delicate ![]() climate
climate![]() system.
system.
Terrestrial - ![]() sea
sea![]()
![]() level
level![]() and elevation changes, albedo feedback and
yields fresh water
and elevation changes, albedo feedback and
yields fresh water
Marine - ice-rifted debris, increases the planet's albedo, ![]() sea
sea![]() air
exchange.
air
exchange.
Lithosphere - 100 km thick layer above the aesthenosphere, mantle, and core - forms the earth's dynamic "plates."
Plate tectonics - 8 major plates and 26 minor plates in dynamic interaction.
Shape and distribution of continents and oceans / pathways - change current patterns and upwelling.
Mountain building - orographic lift - monsoons - weather patterns and creates river drainages.
Uplift and subsidence - equilibrates heat of the earth, forms sedimentary basins.
Volcanism
Gases - composition - greenhouse gases and aerosols.
Ash clouds - albedo and mineral nutrients.
Magma
Topography and bathymetry
Subsurface Atmosphere (Figures 13-16)
Figures 13-16
|
|
Figure 13. Non-linear interactions in a dynamic petroleum
(fluid) system. Inset: Plot of |
|
|
Figure 14. The self-organizing earth machine (Source: Harvard). |
|
|
Figure 15. Late Jurassic - Early Cretaceous: Reconstruction of Late Jurassic paleogeography. |
|
|

Why a Geoscientist (Figure 13)
The reductionist methods of breaking complex systems into simple parts has been partially successful in assessing risk. But it has left a vacuum when it comes to predicting complex fluid streams (oil and gas) in the subsurface realm.
How do we use the information gleaned about the parts to build up a theory of the whole? The deep difficulty here lies in the fact that the complex whole may exhibit properties that are not readily explained by understanding the parts. The complex whole, in a completely nonmystical sense, can often exhibit collective properties, self organizing"emergent" features that are lawful in their own right. (Stuart Kauffman, e.g., 1995)
Sedimentary basin systems--"Similarity to ![]() climate
climate![]() systems" (Figures
14, 15, and
16)
systems" (Figures
14, 15, and
16)
-
The mental model of sedimentary basins envisioned here is that basins are complex, non-linear, self-organizing, dynamic natural systems. They are thrown in and out of thermodynamic and pressure equilibrium and experience obth positive and negative feedback as they attempt to maintain equilibrium throughout their unique evolution.
-
The fluids (oil-gas-water) are the most unstable and mobile parameters of sedimentary basin systems and are the major agents in self organization on the maintenance of equilibrium.
-
Petroleum exploration is the science and art of envisioning multiphase fluid and rock interactions envisioned through time in a high pressure and temperature environment of the subsurface atmosphere.
The Atmosphere (Figures 17, 18, 19, 20, 21, 22, 23, 24, and 25)
Figures 17-25


 Climate
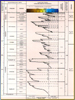
 Reconstruction
Large-scale temperature reconstructions after millennial-scale variations have been removed by de-trending with a cubic smoothing spline with a 50% frequency-response cutoff width equal to 67% of the length of the common period (1000-1980): purple, Briffa (2000); blue, Mann et al (1999); red, Esper et al. (2002); green, Jones et al. (1998). The series are not smoothed to illustrate the full range of variability up to centennial scales. The inter-series correlations between all four reconstructions are 0.42 for non-smoothed data and 0.63 for 50-year smoothed data, both calculated over the 1000-1980 period. Inter-series correlations for each century (1901-1980 for the 20th century) remain fairly high and stable over time (numbers provided in brackets). The lowest correlation (0.27) occurs in the 11th century, despite the fact that the relative data overlap (e.g., Tornetraesk and Polar Urals tree ring data used in all reconstructions) is greatest during this early period. In boxes, the number of the northern hemisphere regional proxy records considered in the large-scale reconstructions are provided for 1900, 1500, and 1000 (colors as for the curves). Values in parentheses indicate numbers of tree ring records. For Mann et al. (1999), 112 in 1900 includes records from the southern hemisphere, and the numbers for 1500 and 1000 include principal components derived from 21 western and 6 southern U.S. tree sites that are counted as two regional records.
Hydrosphere
Figures 26-30
|
|
Click to view sequence of thermohaline circulation through time. |
|
|
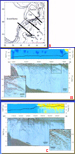
Figure 27. Thermohaline current. A. A schematic of the
ocean circulation system, often called the Great Ocean Conveyor,
that transports heat throughout the world oceans. Red arrows
indicate warm surface currents. Blue arrows indicate deep cold
currents (from Gagosian, 2002). B. New data shows that
North Atlantic waters at depths between 1000 and 4000 meters are
becoming dramatically less salty, especially in the last decade.
Red indicates saltier-than-normal waters. Blue indicates fresher
waters. Oceanographers say we may be approaching a threshold
that would shut down the Great Ocean Conveyor and cause abrupt
|
|
|
|
|
|
Figure 29. Eustatic cycle chart No. 1 - Phanerozoic. (from Vail and Mitchum, 1979). |
|
|
Figure 30. |

Role of Water
Water
is fundamental to creating and regulating the Earth's ![]() climate
climate![]() .
.
-
Oceans - enormous heat capacity, to store and transfer heat in 3 dimensions -
sea
level cycles -
Thermohaline circulation - a major long term regulator of global temperature - on-off switch ?
-
Internal dynamics (El Niño) - a 2-3 year heating event that sets weather patterns
-
Lakes - overturning, moisture, geographic extent, outburst floods
-
River systems - recycle water, carry nutrients to the
sea and mixes -
Subsurface aquifers - facilitates biological processes (respiration and photosynthesis), physical processes (erosion), and chemical processes (dissolution and chemical weathering)
-
Source-rock deposition and preservation
“How
will Earth's ![]() climate
climate![]() respond to ongoing changes in greenhouse gases and
ocean circulation? Answers about the future might be found in the past.”
-- Edouard Bard (Figure 26)
respond to ongoing changes in greenhouse gases and
ocean circulation? Answers about the future might be found in the past.”
-- Edouard Bard (Figure 26)
Isotopic Climate Indicators (Figures
31, 32,
33, 34, and
35)
Deep
![]() sea
sea![]() sediments provide the most stratigraphically complete and globally
representative proxy records of paleoclimate change.
sediments provide the most stratigraphically complete and globally
representative proxy records of paleoclimate change.
Figures 31-35
|
|
Figure 31. Isotopic |
|
|
Figure 32. |
|
|
Figure 33. How solar |
|
|
Figure 34. Synchrony and |
|
|
Figure 35. Indian Ocean |


“Ice Age” (Figure 36)
“It is 12,500 years since the last ice age ended, which means the next one is long overdue. When the ice comes, most of northern America, Britain, and northern Europe will disappear under the glaciers. In this remarkable book, an eminent scientist presents his revolutionary theory on the cause of ice ages and warns that a new ice age may be near.
“In conflict with the traditional view that ice ages build up gradually over thousands of years, Sir Fred Hoyle argues convincingly that the right conditions can arise within a single decade. His fascinating theory is supported with evidence drawn from geology, astronomy, evolution, and a study of unusual weather patterns. In showing that an ice age is imminent, he sets out what needs to be done urgently now to avoid this, the ultimate human catastrophe.” (Hoyle, 1981)
 |
Climate Change and Human History/Migrations
(Figures 37,
38, 39,
40, 41,
42, 43,
and 44)
Figures 37-44


Lithosphere (Figure 45)
Lithosphere is a 100-km-thick layer above the aesthenosphere, mantle, and core. It forms the Earth's dynamic plates
Plate Tectonics - 8 major plates and 26 minor plates in dynamic interaction
-
Shape and distribution of continents and oceans - change current patterns and upwelling - spreading rifts.
-
Mountain building - orographic lift - monsoons - weather patterns and creates river drainages.
-
Uplift and subsidence - equilibrates heat of the earth, forms sedimentary basins.
Volcanism - interaction of the earth's interior with the atmosphere
-
Gases - composition - greenhouse gases.
-
Ash clouds - albedo and mineral nutrients.
-
Magma - minerals, heat, nutrients and topography.
-
Topography and bathymetry - seafloor spreading ridges, large igneous provinces (LIPS), and mountain ranges with glaciers, ocean current pathways.
|
|
Figure 45. Dynamics of planet earth; planetary - terrestrial - marine factors. |
Climatology - A Developing "Science" (Figure 46)
![]() Climate
Climate![]() science is developing rapidly - we are in the steep part of the learning
curve.
science is developing rapidly - we are in the steep part of the learning
curve. ![]() Climate
Climate![]() change science must integrate atmospheric science with
the other physical sciences.
change science must integrate atmospheric science with
the other physical sciences.
 |
Figure 46. Complexity of climatology, with its interacting mechanisms. |
Coupled Behavior and Feedback
-
The interacting mechanisms can exhibit collective, non-linear properties "emergent" features that are lawful in their own right.
-
The search for predictable properties of hybrid forces is emerging as a fundamental research strategy in
climate research.
Future Research Areas
Processes
-
Ocean circulation - deep and global
-
Land-ice behavior - conditions beneath ice sheets
-
The hydrological cycle - storage, runoff and permafrost
-
Modes of atmospheric behavior - cloud formation
-
The sun's irradiance variability
-
Develop additional proxies of paleoclimates - (isotopes & biologic)
Advanced Modeling
-
To model complex, non-linear interacting processes
-
Fully coupled whole earth system models - to generate scenarios of abrupt
climate change
with high spatial and temporal resolution for tracking -
Advanced statistical methods to model to understand thresholds and non-linear ties in geophysical, ecological and economic systems
Tools
-
Enhanced computational resources for modeling
-
New satellite data for mapping temperature, detailed bathymetry, uplift-subsidence and eustatic
sea level -
A grid of earth measuring stations for better geographic coverage and temporal resolution - EarthScope, Nanno / reporting stations
Climate
Change Science Program (Figures
47, 48, and
49)
Figures 47-49
|
|
Figure 47. Cover of a report by the |
|
|
Figure 48. Guiding vision for the CCSP: A nation and the global
community empowered with the science-based knowledge to manage
the risks and opportunities of change in the |
|
|
Figure 49. |


Global
Climate and Energy Project (Figures
50, 51,
52, 53,
54, and 55)
“Our
investment in GCEP is a demonstration of our long-held belief that
successful development and global deployment of innovative, commercially
viable technology is the only path that can address long-term ![]() climate
climate![]() change risks while preserving and promoting prosperity of the world's
economies. ExxonMobil is proud to work with a university of the
reputation, experience, and ability of Stanford, and to be among the
select group of sponsors coming together to make this project happen.”
(Lee Raymond, ExxonMobil Chairman and CEO.)
change risks while preserving and promoting prosperity of the world's
economies. ExxonMobil is proud to work with a university of the
reputation, experience, and ability of Stanford, and to be among the
select group of sponsors coming together to make this project happen.”
(Lee Raymond, ExxonMobil Chairman and CEO.)
“There is much to do, but there is much that can be done, and the time to start is now.” (Professor Franklin [Lynn] Orr, GCEP Project Director.)
Figures 50-55
|
|
Figure 50. GCEP (Global |
|
|
|
|
|
|
|
|
|
|
|
|
|
|


Green Market and Environmental Crisis (Figures 56 and 57)
As emissions rise. . ., a new market is born. It shows industry moving on global warming. Even as Bush opposes Kyoto, firms are trading rights to emit greenhouse gases. (Jeffrey Ball, The Wall Street Journal, January, 2003.)
Figures 56-57
|
|
|
|
|

A Geoscientist's View+
Some people, NGO's, politicians and some environmental scientists, genuinely subscribe to a gloomy picture of the Earth's future. Many of these scientists are not uninformed, nor naive, or unprofessional, or captive to special interests; but they have indeed moved into a pessimistic sphere that generates an environment of righteousness, elitism, environmental orthodoxy, and a view of "science" that aims at forgone conclusions and the need forever-increasing research grants.
The
last decade has seen a rapid advancement of the ![]() climate
climate![]() sciences. The
intellectual stream of thought from Data -> Information -> Knowledge ->
Integration -> Wisdom has experienced step function advancements at many
levels since the early 1990's. State-of-the-Art science for
decision-making is critical for global environmental care and economic
prosperity.
sciences. The
intellectual stream of thought from Data -> Information -> Knowledge ->
Integration -> Wisdom has experienced step function advancements at many
levels since the early 1990's. State-of-the-Art science for
decision-making is critical for global environmental care and economic
prosperity.
I am optimistic about the Earth's environmental future, and I believe there is plenty of evidence to support an optimistic, though not cornucopian, view of our planet's environmental future.
If one believes that affluence fosters environmentalism, then the essential prerequisites for our earth's environmental future are a global transition from poverty to affluence coupled with transition to freedom and democracy and the growth of scientific knowledge.
(+After Dr. Jack M. Hollander, 2003)
Summary
-
Climate science is
developing rapidly - we are in the steep part of the learning curve.
Climate change science must integrate atmospheric science with the
other pertinent scientific disciplines.
-
We do not yet understand the complex processes of
climate system well enough to
construct rigorous models of future climate change. -
The continents and oceans are being systematically "wired" with broadband communications, sensors and satellites that are recording vast amounts of global data and information.
-
The massive data sets and rapidly evolving concepts of
climate change will spark public
debate at an increasing rate. -
Mutual respect and honest debate are critical to the advancement of the science.
 |
++Other references are given with the text and figure captions.
Abdul Aziz, Hayfaa, Sanz-Rubio, Enrique, Calvo, J.P. Hilgen, F.J., and Krijgsman, W., 2003, Palaeoenvironmental reconstruction of a middle Miocene alluvial fan to cyclic shallow lacustrine depositional system in the Calatayud Basin (NE Spain): Sedimentology, v. 50, p. 211-236.
Alley, R.B., 2000, Ice-core evidence of abrupt ![]() climate
climate![]() changes: Proceedings of the National Academy of Sciences, v. 97, p.
1331-1334.
changes: Proceedings of the National Academy of Sciences, v. 97, p.
1331-1334.
Alley, R.B., P.A. Mayewski, T. Sowers, et al., 1997, Holocene climatic instability: A prominent widespread event 8200 years ago: Geology, v. 25, p. 483-486.
Barry, R.G., and R.J. Chorley, 1968, Atmosphere,
weather and ![]() climate
climate![]() (first edition):
Methuen and Co. Ltd., London), 319 p.
(first edition):
Methuen and Co. Ltd., London), 319 p.
Bord, Edouard, 2002, ![]() Climate
Climate![]() shock: Abrupt changes over
millennial time scales: Physics Today, December.
shock: Abrupt changes over
millennial time scales: Physics Today, December.
Briffa, K.R., 2000: Annual ![]() climate
climate![]() variability in the
Holocene; interpreting the message of ancient trees: Quaternary Science,
v. 19, p. 87-105.
variability in the
Holocene; interpreting the message of ancient trees: Quaternary Science,
v. 19, p. 87-105.
Bryant, E.A., 1997, ![]() Climate
Climate![]() process and change: Cambridge
University Press, 209 p.
process and change: Cambridge
University Press, 209 p.
Burns, S.J., D. Fleitmann, A. Matter, et al., 2003,
Indian Ocean ![]() climate
climate![]() and an absolute chronology over Dansgaard/Oeschger
events 9 to 13: Science,
v. 301, p. 1365-1367.
and an absolute chronology over Dansgaard/Oeschger
events 9 to 13: Science,
v. 301, p. 1365-1367.
Campbell, W.H., 2003, Introduction to geomagnetic fields, 2nd edition: Cambridge University Press, 350 p.
Cande, S.C., and D.V. Kent, 1995, Revised calibration of the geomagnetic polarity timescale for the Late Cretaceous and Cenozoic: Journal of Geophysical Research, v. 100, p. 6093-6095.
Cann, R.L., and A.C. Wilson, 2003, The recent African genesis of humans, in New look at human evolution: Scientific American Digital Special Edition; also, Wilson, A.C., and R.L. Cann, 1992, The recent African genesis of humans: Scientific American, v. 266, p. 68-73.
Cronin, T.M., R.Z. Poore, J.J. Dowsett, and R.S. Thompson, 1993, Pliocene climates, in Proceedings of the U.S. Geological Survey global change research forum, Herndon, Virginia, March 18-20, 1991, p. 51-52.
Crowley, T.J., 1996, Remembrance of things past: Greenhouse lessons for the geologic record: Consequences, v. 2., p. 3-12.
Crowley, T.J., 2000, Causes of ![]() climate
climate![]() change over the
past 1000 years. Science, v. 289, p. 270-277.
change over the
past 1000 years. Science, v. 289, p. 270-277.
Crowley, T. J. and Lowery, T., 2000: How warm was the
Medieval Warm Period ? A comment on "Man-made versus Natural ![]() Climate
Climate![]() Change". Ambio 39, 51-54.
Change". Ambio 39, 51-54.
Crowley, T.J., and G.R. North, 1991, Paleoclimatology: Oxford University Press, New York.
Cuffey, K. M., and G.D. Clow, 1997, Temperature, accumulation and ice sheet elevation in central Greenland through the last deglacial transition: Journal of Geophysical Research, v. 102 (C12), p. 26383-26396.
Cuffey, K.M., R.B. Alley, P.M. Grootes, J.F. Bolzan, and S. Anandakrishnan. 1994. Calibration of the delta18O isotopic paleothermometer for central Greenland, using borehole temperatures: Journal of Glaciology, v. 40, p. 341-349.
Dansgaard, W., S.J. Johnsen, H.B. Clausen, et al., 1993,
Evidence for general instability of ![]() climate
climate![]() from a 250-kyr ice-core
record: Nature, v. 364,
p. 218-220.
from a 250-kyr ice-core
record: Nature, v. 364,
p. 218-220.
Esper, J., Frank, D.C., and Wilson, R.J.S., 2004, ![]() Climate
Climate![]() reconstructions - low frequency ambition and high frequency
ratification: EOS 85, no. 12, p.113, 120.
reconstructions - low frequency ambition and high frequency
ratification: EOS 85, no. 12, p.113, 120.
Esper, J., Cook, E.R., and Schweingruber, F.H., 2002, Low-frequency signals in long tree-ring chronologies and the reconstruction of past temperature variability: Science, v. 295, p. 2250-2253.
European Southern Observatory, 2003, Cover (spiral galaxy NGC 1232, September 21, 1998).
Fuchs, R.J., E. Brennan, J. Chamie, et al., eds., 1994, Mega-city growth and the future: United Nations University Press, Tokyo.
Gagosian, R.B., 2003, Abrupt ![]() climate
climate![]() change: Should we be
worried?--presentation for panel on abrupt
change: Should we be
worried?--presentation for panel on abrupt ![]() climate
climate![]() change at the World
Economic Forum, Davos, Switzerland, January 27, 2003 (http://www.eprida.com/hydro/
change at the World
Economic Forum, Davos, Switzerland, January 27, 2003 (http://www.eprida.com/hydro/![]() climate
climate![]() /woodshole/WHclimatereport.htm)
/woodshole/WHclimatereport.htm)
Gagosian, R.B., 2002, Can global warming trigger an ‘Ice Age’?: Presentation, July, 2002: Woods Hole Oceanographic Institution.
Gerhard, L.C., and W.E. Harrison, 2001, Distribution of
oceans and continents: A geological constraint on global ![]() climate
climate![]() variability, in Geological perspectives of global
variability, in Geological perspectives of global ![]() climate
climate![]() change: AAPG
Studies in Geology #47, p. 35-49.
change: AAPG
Studies in Geology #47, p. 35-49.
Graedel, T.E., and P.J. Crutzen, 1993, Atmospheric change: An earth system perspective: Freeman and Co., New York, 446 p.
Hansen, J., R. Ruedy, J. Glascoe, and M. Sato, 1999, GISS analysis of surface temperature change: Journal of Geophysical Research, v. 104, p. 30997-31022.
Hicke, J.A., Asner, G.P., Randerson, J.T., et al., 2002, Satellite-derived increases in net primary productivity across North America, 1982–1998. Geophysical Research Letters, 29 1029/ 2001GL013578.
Holbrook, W.S., P. Paramo, S. Pearse, and R.W. Schmitt, 2003, Thermohaline fine structure in an oceanographic front from seismic reflection profiling: Science, v. 301, p. 821-824.
Hollander, Jack M., 2003, The real environmental crisis: Why poverty, not affluence, is the environment's number one enemy: The University of California Press, 251 p.
Hoyle, Fred, 1981, Ice: The ultimate human catastrophe: The Continuum Publishing Company.
Jet Propulsion Laboratory, 2004, Education – Class activities: TOPEX/Poseidon on-line tutorial (http://topex-www.jpl.nasa.gov/education/tutorial.html).
Johnsen, S.J., H.B. Clausen, W. Dansgaard, et al., 1992, Irregular glacial interstadials recorded in a new Greenland ice core: Nature, v. 359, p. 311-313.
Johnston, Nels, Carmen Revenga, and Jaime Echeverria., 2001, Managing water for people and nature: Science, v. 292, 11 May, p. 1071-1072.
Jones, P.D., Briffa, K.R., Barnett, T.P., and Tett, S.F.B., 1998, High-resolution palaeoclimatic records for the last millennium: interpretation, integration and comparison with General Circulation Model control run temperatures. The Holocene, v. 8, p. 455-471.
Kauffman, S., 1995, At home in the universe: The search for laws of self organization and complexity: Oxford University Press, 321 p.
Kerr, Richard A., 1993, Even warm climates get the shivers: Science, v. 261, p. 292.
Krishnamurti, T.N., 2002, United Nations Environment Programme (UNEP) Assessment Report: Part III: Global and future implications, p. 47.
Kuring, N., 2002, UNEP assessment report, p. 1.
Lean, J., J. Beer, and R. Bradley, 1995, Reconstruction
of solar irradiance since 1610: Implications for ![]() climate
climate![]() change:
Geophysical Research Letters, v. 22, p. 3195-3198.
change:
Geophysical Research Letters, v. 22, p. 3195-3198.
Leroux, M., The mobile polar highs: A new concept explaining present mechanism of meridional air-mass and energy exchanges and global propagation of palaeoclimatic changes: Global and Planetary Change, v. 7, p. 69-93.
Lockwood, M., Stamper, R., and Wild, M.N.: 1999, A doubling of the sun’s cornal magnetic field during the last 100 years: Nature, v. 399, p. 437-439.
Lunar and Planetary Laboratory, University of Arizona, 2003, Chicxulub impact event (http://www.lpl.arizona.edu/sic/impact_catering/chicxulub/chicx_title.html.
Lyle, M.W., et al., 2002, Leg 199 Scientific Prospectus: ODP, v. 199.
Mahoney, J.R., 2002, The U.S. ![]() climate
climate![]() change science
program: NOAA presentation (www.sab.noaa.gov/Presentations/SAB_2002_11November-09_Climate%20Change%20Program%20-%20Mahoney.ppt).
change science
program: NOAA presentation (www.sab.noaa.gov/Presentations/SAB_2002_11November-09_Climate%20Change%20Program%20-%20Mahoney.ppt).
Mann, M.E., Bradley, R.S., and Hughes, M.K., 1999,
Northern hemisphere temperatures during the past millennium: Inferences,
uncertainties, and limitations: Geophysical Research Letters, v. 26, p.
759-762; also, Mann, M.E., Bradley, R.S. and Hughes, M.K., 1998:
Global-scale temperature patterns and ![]() climate
climate![]() forcing over the past six
centuries. Nature, v. 392, p. 779-787.
forcing over the past six
centuries. Nature, v. 392, p. 779-787.
Pang, K.D., and Yau, K.K., 2002, Ancient observations
link changes in sun's brightness and earth's ![]() climate
climate![]() . EOS, Transactions,
American Geophysical Union, v. 83, p. 481, 489-490.
. EOS, Transactions,
American Geophysical Union, v. 83, p. 481, 489-490.
Petit J.-R., J. Jouzel, D. Raynaud, et al., 1999. ![]() Climate
Climate![]() and atmospheric history of the past 420,000 years from the Vostok ice
core, Antarctica. Nature, v. 399, p. 429-436.
and atmospheric history of the past 420,000 years from the Vostok ice
core, Antarctica. Nature, v. 399, p. 429-436.
Plagnes, V., Causse, C., Fontugne, M., et al., 2003, Cross dating (Th/U and 14C) limits for an open system: calcite covering prehistoric paintings in Borneo: Quaternary Research, v. 60, p. 172-179.
Prakash, A., 2005, Photo in Fieldwork campaign in Ruqigou coalfield, China: International Institute for Geo-Information Science and Earth Observation (ITC) (http://www.itc.nl/personal/coalfire/poster/fieldwork.pdf); also Discover, October 1999, and Stracher, Glenn B., 2002, Coal fires: A burning global recipe for Catastrophe: Geotimes, October, p. 36-37, 66.
Ramankutty,
N., and J.A. Foley, 1999, Estimating
historical changes in global land cover: Croplands from 1700 to 1992:
Global Biogeochem. ![]() Cycles
Cycles![]() , v. 13, p. 997–1027.
, v. 13, p. 997–1027.
Rumney G., 1968. Climatology and the World's ![]() Climate
Climate![]() .
MacMillan Company, New York.
.
MacMillan Company, New York.
Scotese, Christopher R., 2003, Modern world, in Site Map: PALEOMAP Project (http://www.scotese.com/modern.htm).
Sittel, M, 1994, Differences in the means of ENSO extremes for maximum temperature and precipitation in the United States: Center for Ocean-Atmospheric Prediction Studies, The Florida State University, Technical Report 94-2, unpaginated.
Trenberth, K.E., and B.L. Otto-Bliesner, 2003, Paleoclimate: Toward integrated reconstruction of past climates: Science, v. 300, p. 589-591.
UNEP (United Nations Environment Programme), 2002, UNEP Assessment report, p. 1, 12, 47.
UNEP and C4, 2002, The Asian Brown Cloud: ![]() Climate
Climate![]() and
Other Environmental Impacts. United Nations Environment Programme (UNEP),
Nairobi: Executive Summary, p. 289-296 (illustration(s) courtesy of N.
Kuring, NASA Goddard Space Flight Center).
and
Other Environmental Impacts. United Nations Environment Programme (UNEP),
Nairobi: Executive Summary, p. 289-296 (illustration(s) courtesy of N.
Kuring, NASA Goddard Space Flight Center).
Unisys Weather, 1999, Upper air chart and surface temperature charts for February 13, 1999; in archives for February 1999 (http://weather.unisys.com/archive).
Vail P.R., and R.M. Mitchum, Jr., 1979, Global ![]() cycles
cycles![]() of
relative changes of
of
relative changes of ![]() sea
sea![]()
![]() level
level![]() from seismic stratigraphy: resources,
comparative structure, and eustatic changes in
from seismic stratigraphy: resources,
comparative structure, and eustatic changes in ![]() sea
sea![]()
![]() level
level![]() , in
Geological and geophysical investigations of continental margins: AAPG
Memoir 29, p. 469-472.
, in
Geological and geophysical investigations of continental margins: AAPG
Memoir 29, p. 469-472.
Zachos, J., M.
Pagani, L. Sloan, et al., 2001,
Trends, rhythms, and aberrations in global ![]() climate
climate![]() 65 Ma to present:
Science, v. 292, p.
686-693.
65 Ma to present:
Science, v. 292, p.
686-693.