 Click to view article as PDF
GCValue in Visualization*
By
Tracy J. Stark1
Search and Discovery Article #40133 (2004)
*Adapted from the Geophysical Corner column in AAPG Explorer, June, 2004, entitled “Why Do We Need to Have Visualization?” and prepared by the author. Appreciation is expressed to the author, to Alistar R. Brown, editor of Geophysical Corner, and to Larry Nation, AAPG Communications Director, for their support of this online version.
1STARK Research, Plano, Texas ([email protected])
 Introduction
How do you convince “a non-believer,” in a short article with only a few static figures, the need for visualization?
Within some
companies the value of integrating visualization techniques into the ![]() exploration
exploration![]() workflow is well documented (pun intended). In these companies, the answer is
along the lines of: “In order to get a well drilled, it is required by those
whose money we are using to drill the well, since it has shown repeatedly to be
an excellent risk reducer and a very good return on investment.”
workflow is well documented (pun intended). In these companies, the answer is
along the lines of: “In order to get a well drilled, it is required by those
whose money we are using to drill the well, since it has shown repeatedly to be
an excellent risk reducer and a very good return on investment.”
Visualization
encompasses the software, hardware, and workflow combination that allows trained
and experienced interpreters to investigate rapidly – and communicate to others
– the internal heterogeneities of their ![]() 3-D
3-D![]() data volume. All three components
are important, but the workflow element is probably the most important. It is
the workflow that allows you to answer the questions you need to ask of the
data. If you choose the wrong workflow, some questions will remain unanswered,
or poorly answered. The ability to use a particular workflow effectively depends
upon the software package employed. For example, package A is better than
package B for quickly comparing multiple attributes on a particular section of
data. Yet, package B’s ability to opacity filter large volumes is significantly
better than package A’s for identifying regional amplitude anomalies.
data volume. All three components
are important, but the workflow element is probably the most important. It is
the workflow that allows you to answer the questions you need to ask of the
data. If you choose the wrong workflow, some questions will remain unanswered,
or poorly answered. The ability to use a particular workflow effectively depends
upon the software package employed. For example, package A is better than
package B for quickly comparing multiple attributes on a particular section of
data. Yet, package B’s ability to opacity filter large volumes is significantly
better than package A’s for identifying regional amplitude anomalies.
|
|
Case for VisualizationThe growing
amount of available If you
assume that a full stack and three additional attribute volumes (such as
a near-, mid- and far-stack volume) need to be interpreted, then by the
end of 2002 these combined volumes could cover the entire United States.
The speed, efficiency, completeness, and multiple workflows available
from visualization tools are required to keep up with the growing data
volumes. Moore’s Law is yet another reason you need to use
visualization techniques, and continually upgrade your computers and
graphics system. Moore’s Law implies that if you upgrade your
visualization hardware every three years you will catch up on the growth
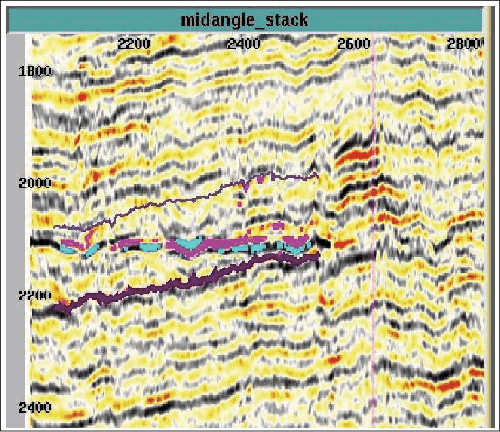
of the If your competitors are using visualization tools and continually upgrading their hardware and you are not, how much farther behind are you falling? However, the most compelling reason that you need to use visualization tools is that if you don’t, you probably will miss important features of your data volume, such as detailed depositional patterns and large regional flat spots.
ExamplesFigure 1 contains 12 sub-images showing changing depositional patterns. The first sub-image is of the volume-sculpted package. The other 11 images are proportional (stratal) slices through this package. Slices (3) through (11) were taken proportional distances from the top and bottom of the two bounding surfaces (2) and (12). The depositional patterns in the proportional slices are not apparent on either of the bounding surfaces, nor are they readily apparent in the volume-rendered sub-volume. Such details are important as they indicate possible flow boundaries or conduits as well as give clues where other sands might have been deposited. A volume
rendering of the largest amplitudes found in the mid-angle stack over an
undeveloped West Africa field is shown in Figure
2. This is an end-on view of a ~300-square-kilometer survey. The
sands of the field, which are expected to contain in the range of 500
bcfg to 1 tcf gas within the limits of the The flat spot at 2100 ms is hard to miss – however, at least seven different evaluation teams did not identify it as a drilling target. Clearly these teams did not generate a similar display. Most of these teams concentrated their efforts on the slightly deeper (250+ ms) objective known to contain hydrocarbons and believed to be part of a giant regional stratigraphic trap. How many of us don’t have or take the time to explore the volume above or below our current objective? Do you know what you are missing? A thick, volume-rendered, opacity-filtered time-slice around 2100 ms, again just showing the largest amplitudes, is provided in Figure 3. The five wells, drilled for the deeper target, missed hitting the 60-square-kilometer flat spot, even though it covers about 20 percent of the survey. The two wells that clipped the edge of the flat spot should be investigated for oil shows. The AVO nature of this event is illustrated with Figure 4. It is not a “textbook” example of a fluid contact. The “reservoir sands” are hard to discern on the vertical sections; they do not have the textbook behavior on either side of the “fluid contact,” and the contact appears locally to “change phase.” The “contact” also appears to have some localized “velocity pull down.” However, until the gathers are evaluated for proper processing and rock property modeling has been done, a hydrocarbon effect should not be ruled out. If the flat spot is a fluid contact, then optimistic approximations to the reservoir geometry and properties imply over five billion barrels of oil in place within the limits of the survey. Figure 3 indicates that the flat spot should extend beyond the survey limits. If the right visualization tools and workflow were utilized earlier in the project, slight modifications to two of the drilled well paths could have allowed testing of this potential reservoir. So is this a missed billion-barrel field? Only a well will tell. For those of you who still don’t think you need visualization, you might be right, for in the words of Edward Deming: “It is not necessary to change. Survival is not mandatory.” |


