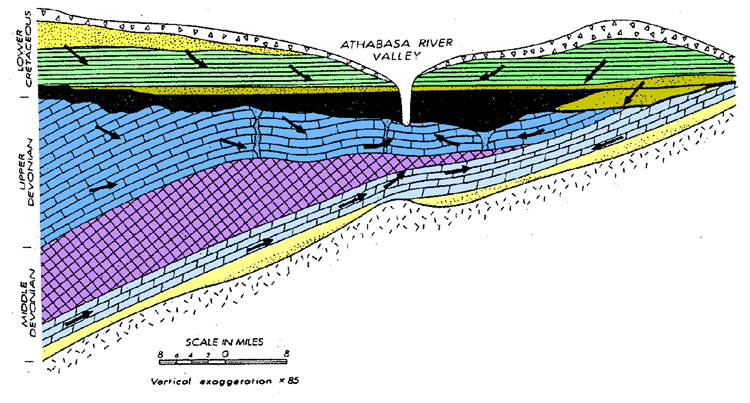
Figure 5. Schematic diagram of regional groundwater flow and salt collapse (from Page, 1974). Reproduced with the permission of the Canadian Society of Petroleum Geologists.
Figure 5. Schematic diagram of regional groundwater flow and salt collapse (from Page, 1974). Reproduced with the permission of the Canadian Society of Petroleum Geologists.