![]() Click
to view poster presentation in PDF format.
Click
to view poster presentation in PDF format.
Tectonic Evolution and Hydrocarbon Migration Synchronization in the Eastern Venezuela Basin / Tacata Area*
By
José F. Mijares1, Maria Silva1, Wilfredo Maestracci1, and Euries Gil1
Search and Discovery Article #10070 (2004)
*Adapted from poster presentation at AAPG Annual Convention, Dallas, TX, April 18-21, 2004.
1PDVSA, Puerto La Cruz, Venezuela ( [email protected] )
The study area is located to the northeast of the Anaco town of the Anzoátegui State, eastern Venezuela. Analysis of seismic lines from an interpreted seismic volume, using stratigraphic data and geometric seismic patterns, reveals the tectonic evolution in the study area. The results indicate the succession of four different basins:
1. A Jurassic extensional basin.
2. A Cretaceous passive margin basin.
3. A transitional basin that started with the deposition of the Oligocene and proceeded with the Miocene sediments, both of them showing a growing influence of the advancing Caribbean Tectonic Plate.
4. A middle to late Miocene foreland basin with its thrusts faults and décollements. The faults, thrust faults, traps, and hydrocarbons present in the study area were developed during the last 10 million years.
The team was able to order the succession of the tectonic events. Then using these results and the data provided by the wells around the area, they fed the Basinmod software in order to model the burial of the sediments, as well as the generation and expulsion of the hydrocarbons. The results indicated that there are 5 different tectonics blocks, each one with two source rocks that started generating hydrocarbons at different times. The results also show that the petroleum system worked perfectly for four of these blocks.
|
|
Methodology and Interpretation
Globally, the study area is located on the west side of the Eastern Venezuela Basin (Figure 1.1), at the confluence of the Tala thrust and the lateral ramp of the Pirital thrust (Urica fault). South of the La Serrania del Interior’s foothills, on the border of the Anzoátegui and Monagas states.
MethodologyMethodology, as illustrated in Figure 1.2, consisted of:
Stratigraphic ColumnThe stratigraphic section of interest is the Oligocene-Pleistocene (Figure 1.3). The Cretaceous, below an unconformity, is undifferentiated.
Previous Work and Activity (Figure 1.4) Exploration activity began in the 1940’s. The first well, T-51, was drilled in the area in 1952. In 1953, interest waned after the drilling of a few dry wells. Exploration was resumed in 1986, with the drilling of T-11, which was a dry hole. Twelve years later, in 1998, TAG-12 was drilled with excellent results, and the area was once again opened. In 2001, TAG-16 became the best well in the area. In 2003, TAC-2 opened a new area for exploration.
Well Data – Seismic Calibration and Interpretation (Figures 1. 5, 1.6, 1.7, 1.8, 1.9, and 1.10) Data from TAG-16, a very successful well in the area, and from two seismic lines were used in this study. The seismic lines are S-N line 10575 and W-E line 10433. The well site was selected at the intersection of these two lines.
Interpretation of Geometrical Seismic PatternFigure Captions (2.1-2.8)
The geometrical pattern that was interpreted in this study had to satisfy the various requisites of a balanced section (Figure 2.1). The different colored rectangles in Figure 2.2 coincide with the zoom-up portions of seismic line 10575. The interpretation is that the thrusts advanced from the north and formed a triangular zone with the foreland. The thrusts keep a normal sequence. Figure 2.3 shows that sedimentation proceeded with little interruption in the study area. The alternating sands and shales of the Miocene Capaya Formation contain two source rocks, as proposed for this area. The seismic does not show any evidence of tectonism, indicating that the area was located in the foredeep. The major fault is reverse, and it was active after sedimentation, as there are no thickness changes across the fault. In Figure 2.4, middle Miocene, which is shown to have been deposited concordantly on top of the lower Miocene, is represented by the Carapita and Freites formations. The latter is located south of the foreland-dipping passive thrust. In comparison, the top of the middle Miocene (Uchirito Formation) is marked by an unconformity (Figure 2.5). The ages of the units are from biostratigraphic data. Nevertheless, the unconformity is expressed by the geometrical relationships of the different horizons. Uchirito and Morichito formations were being deposited 12.5 Ma, the former in front (south) of the Tala block and the latter on top of it. The Tala block started to be emplaced in the area 13.5 Ma. It then was uplifted and eroded before it subsided. The synclinal folding, as well as onlapping onto the Cretaceous block, indicates that there was subsidence while deposition was taking place (Figure 2.6). The passive backthrust does not cut sediments because it is uplifted by the underthrusting of the thrust blocks advancing from the north (Figure 2.7). This means that the thrusts from the north have to be younger than the already deposited middle Miocene sediments. The La Pica Formation is folded and thins in the direction of maximum uplift of the backthrust, as does the Mesa Las Piedras Formation. This relationship indicates that the La Pica was being deposited when the passive backthrust was being formed. Therefore, the thrusts that formed the traps began to be emplaced in the area approximately 10 Ma. The base of the Mesa Las Piedras Formation in Figure 2.8 is an unconformity that truncates the La Pica, Freites, Uchirito, Carapita, and Morichito formations. This relationship indicates that there has been minor movements during the last 5.5 My.
Tectonic Evolution in the Tacata AreaFigure Captions (2.9-2.10)
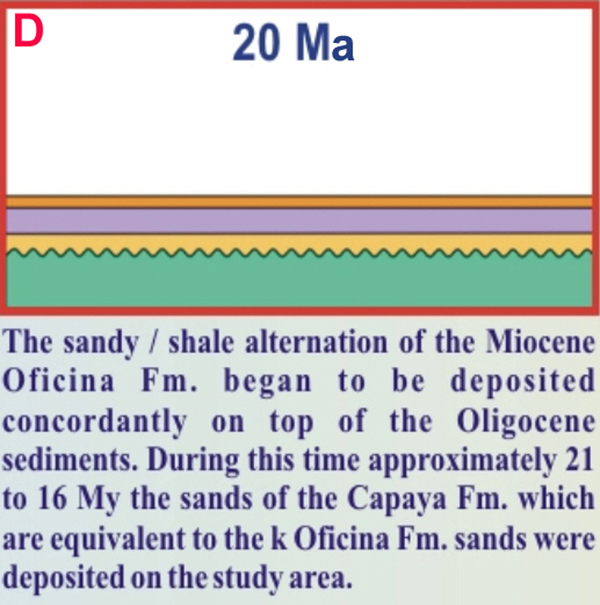
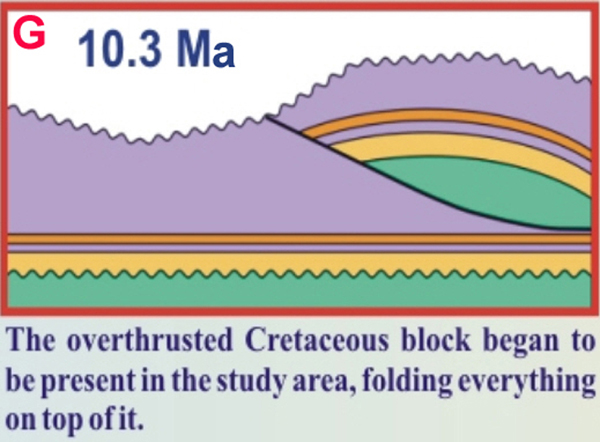
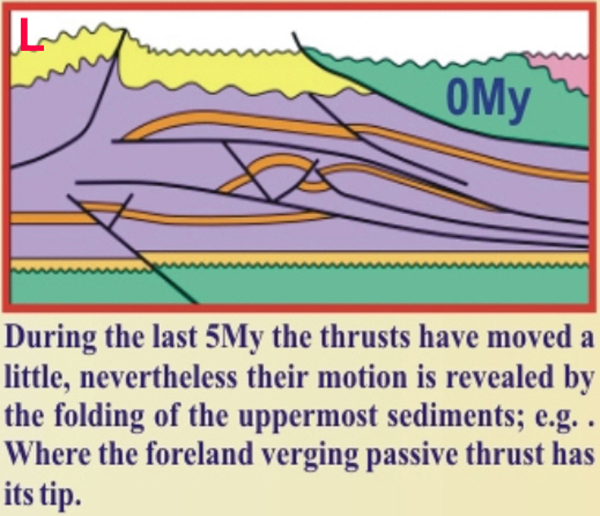
History and ReconstructionThe Cretaceous rocks deposited 66 Ma on South America’s north passive margin are considered to be the deep economic basement in the Tacata area (Figure 2.9A). After Cretaceous deposition (65.5 Ma) and prior to deposition during the Oligocene, the Cretaceous sediments were eroded (Figure 2.9B). Oligocene sediments were deposited 25Ma in a stable tectonic basin even though the Caribbean and South American plates were colliding far to the west (Figure 2.9C). The alternating sands and shales of the Miocene Oficina Formation were deposited concordantly on top of the Oligocene (Figure 2.9D). During this time, approximately 21 to 16 Ma, the sands of the Capaya Formation, which are equivalent to the K sands of the Oficina, were deposited. Sedimentation from early to middle Miocene (17 Ma) took place without any interruption in the study area (Figure 2.9E). Based on the research of different companies in nearby areas, rocks of the same age have different names; e.g., K and L sands of the Oficina Formation. The top of the middle Miocene Carapita Formation has been eroded in the study area. This erosion took place approximately 14.5 Ma as a consequence of the uplift caused by the proximity of collision between the Caribbean and South American plates (Figure 2.9F). The overthrusted Cretaceous block began to move 10.3 Ma into the study area, folding all the younger strata on it (Figure 2.9G). The overthrusted block continued to move forward and upward (8 Ma). The Miocene and Oligocene sediments on top of the Pirital-Tala block are eroded, together with portions of Cretaceous rocks (Figure 2.9H). The La Pica and Morichito formations began to be deposited. The thrusts continued to advance, and multi-thrusts developed in the study area (7 Ma). The Morichito and La Pica formations began to be folded, as they were deposited (Figure 2.9I). By 5 Ma, the thrusts were more or less in their current position; the foreland-dipping passive thrust started to be uplifted (Figure 2.9J). Deposition of the Morichito and La Pica formations essentially ended, just prior to major uplift. The thrusts continue to move, and the entire area is uplifted and eroded (Figure 2.9K). During the last 5 My. the thrusts have moved little; nevertheless, their motion is revealed by folding of the uppermost sediments; e.g., the tip of the foreland-verging passive thrust (Figure 2.9L).
Basin EvolutionSedimentation in the area began during the Jurassic time when the North and Southern American continental plates began to rift apart. This rifting basin gave way to a passive margin basin during the Cretaceous. Then the area was subjected to subaerial erosion during the Eocene. The area subsided again during the Oligocene. Meanwhile the Caribbean plate was approaching the area and began to collide with the South American plate far to the west of the study area. T his collision is marked by a thickening of Oligocene strata to the west and to the north. Sedimentation and the advancing Caribbean plate proceeded continually to middle Miocene. The change from passie margin to foreland basin was not abrupt, but rather smooth. The beginning of the foreland basin was marked by erosion (12.5 Ma); this surface and overlying strata dip to the northeast, indicating that basin dip changed to the northeast. Subsequently, the basin began to be closed by sedimentation and advancing of the thrusts from the northeast to southeast. Today the basin area is exposed to erosion, and the thrusts have formed a triangular zone with the foreland passive margin backthrust (Figure 2.10).
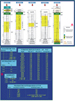
Oil and Gas Generation and ExpulsionFigure Captions (3.1-3.7)
Geologic and geochemical data (Figures 3.1, 3.2, and 3.3) were integrated to develop modeling and then to determine the attributes of a petroleum system (Figures 3.4, 3.5, 3.6, and 3.7).
Conclusions
Recommendations
|


