![]() Click to view article in PDF format.
Click to view article in PDF format.
![]() From
From![]() the Geologists’ Eyes to Synthetic Core Descriptions: Geological Log
Modeling Using Well-Log Data
the Geologists’ Eyes to Synthetic Core Descriptions: Geological Log
Modeling Using Well-Log Data
By
Benoit Mathis1, Jean Pierre Leduc1, and Thibault Vandenabeele1
Search and Discovery #40109 (2004)
*Adapted ![]() from
from![]() “extended abstract” for
presentation at the AAPG Annual Meeting, Salt Lake City, Utah, May 11-14, 2003.
“extended abstract” for
presentation at the AAPG Annual Meeting, Salt Lake City, Utah, May 11-14, 2003.
1Totalfinaelf, 64018 Pau, France
Modeling and propagating core descriptions over uncored areas is of prime
importance regarding the reservoir understanding of a field. Relevant
information observed ![]() from
from![]() only a few cores can be quickly extrapolated over the
whole reservoir using conventional well-log clustering, T2 spectrum
classification, and automated borehole imaging processes. Furthermore, costs
such as core acquisition, storage, and manpower are greatly reduced.
only a few cores can be quickly extrapolated over the
whole reservoir using conventional well-log clustering, T2 spectrum
classification, and automated borehole imaging processes. Furthermore, costs
such as core acquisition, storage, and manpower are greatly reduced.
Geologists usually describe cores in terms of lithology, structure, ![]() texture
texture![]() ,
color, fluid, and fossil content. Most of these items can be investigated by log
analysts except fossil content and color. This paper describes a methodology
designed to reproduce as closely as possible the core description made by the
geologist. It has been proven successful in both clastic and carbonate
reservoirs in terms of facies
,
color, fluid, and fossil content. Most of these items can be investigated by log
analysts except fossil content and color. This paper describes a methodology
designed to reproduce as closely as possible the core description made by the
geologist. It has been proven successful in both clastic and carbonate
reservoirs in terms of facies ![]() prediction
prediction![]() .
.
Firstly, quality control is performed. Borehole images must be pre-processed and
conventional well logs normalized where necessary. In a second step, clustering
tools are used to classify conventional log responses by lithology. Clustering
of the T2 spectrum can also be integrated in order to differentiate between
diverse porosity types. Following this, borehole images are automatically
interpreted in terms of ![]() texture
texture![]() and different types of sedimentary surfaces,
along with their associated attributes.
and different types of sedimentary surfaces,
along with their associated attributes.
The model is created using relationships brought out by calibrating the above results with the core description. Its coherency is evaluated using contingency tables. The resulting ‘‘synthetic core description’’ summarizes all the geological information contained in the full log suite and can be used in a similar manner to a core description.
|
|
Recognition of sedimentary lithofacies is of prime importance when
considering the management of uncertainties for the geological model of
a field. This paper discusses how a facies description can be obtained
Our approach aims to provide rapidly the reservoir geologist with a
virtual core, obtainable throughout the entire reservoir section and
based on the available core data and wireline logs, including EBI and
NMR logs. A sedimentary lithofacies may be first described in terms of
mineralogical content. In the absence of core, this aspect, as well as
reservoir property evaluation, is routinely evaluated by conventional
log interpretation. However, a complete facies description also takes
into account sedimentary structures, In order to create a model, a conventional wireline log suite, borehole imaging log, and representative core data are necessary. This model can then be propagated over any number of wells in an equivalent geological setting that proffer the appropriate data set, giving a complete virtual core over the interval of interest.
Core Data and Conventional Log Analysis The fundamental parameter for accurate modeling is the availability of a relevant and representative core description for use as calibration. However, the interpreter must be aware that logging-tool resolution causes a smoothing (up-scaling) of the basic geological information which must be taken into account during model construction.
All log data are checked and validated (mainly normalized). Wireline log
responses are then analyzed to see which help discriminate core facies.
These are used as inputs for the clustering phase, the results of which
are calibrated to the core facies. A first case study, illustrated in
Figure 2, presents the distribution of the different core facies on a
Density vs. Neutron cross-plot for a - Facies 1 (massive shales) indeed corresponds to the most argillaceous lithologies. - Facies 2 (mud-dominant heterolithic alternations) enriched in quartz compared to Facies 1. - Facies 3 (sand-dominant heterolithic alternations) shows an increase of effective porosity coupled to a trend of decreasing shale content, up to clean siltstones or sandstones. - Facies 4 to 6 are identified as the cleanest sandy lithologies. - Facies 7 (mudstone breccias) is superimposed on the other facies but does not completely belong to the conventional lithology/porosity trend described above. It also appears as an intermediate stage between massive shales and clean, porous sands.
In the case above, comparing the electrofacies classes and the core facies shows that wireline logs permit a confident identification of the distribution of shale, sand, and porosity. In more complex sedimentary environments (e.g., dissolved carbonates), further refinement can be introduced using the T2 NMR spectra (Figure 3), which describe both fluid nature and porosity geometry. For a constant saturation, it is possible to discriminate different porosity network types.
Borehole images are first depth matched with the conventional logs. Checking and repairing the image is a crucial step of the process. The borehole images are then analyzed automatically and a set of relevant data is produced to help with facies identification:
- Image - Bed boundaries take into account specific image attributes (‘‘connective components’’). This process identifies lithological and/or textural changes, although they are not quantified nor qualified. - Bedding takes into account all significant dips, which are automatically picked on the image in a manner comparable to a manual picking.
Additional curves are calculated to characterize the image better, such as event continuity (does it fit all the pads?), event contrast (does it fit a resistivity change?), bedding index (abundance of bedding surfaces in a given depth interval), stratification index (abundance of bed boundaries in a given depth interval), image activity (is the image homogeneous or not?). These are then up-scaled and interpolated to conventional log sampling rate.
The interpreters’ role becomes critical when it comes to combining the
lithology
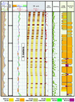
The model can be propagated over all relevant wells with appropriate data sets. Ideally, further comparison should be performed using a cored well kept aside for the purpose of a blind test. Figure 4 shows a complete data set and modeling results: conventional wireline log curves (left side), borehole image (middle track), dipmeter output (bed boundaries in red, bedding in green), and finally the core facies column and the model output (right side).
A continuous description of the well-bore is obtained in terms of geological facies using core descriptions as a reference, and both borehole images and conventional well logs as model inputs. Good success rates have been achieved in both clastic and carbonate environments.
Beyond the calculation of a synthetic facies column, the process leads
to the production of a homogeneous database containing conventional logs
and EBI, available for further geological and reservoir studies (e.g.,
Ye, S., Rabiller, P., and Keskes, N., 1997, Automatic high resolution sedimentary dip detection on Borehole Imagery - SPWLA 38th annual symposium. Ye, S., and Rabiller, P., 2000, A new tool for electro-facies analysis: Multi-resolution graph-based custering - SPWLA 41st annual symposium. Leduc, J.P., et al., 2002, FMI based sedimentary facies modeling, Surmont lease (Athabasca, Canada). |