|
Figure Captions (1-5)
Return to top.
In December 1941, the AAPG published the
902-page symposium, Stratigraphic Type Oil Fields, edited by A.I.
Levorsen. A foreword to the symposium was written by Levorsen. In the
first two sentences he stated - "The backbone of the literature of
petroleum geology is a description of an oil field - its history, its
geology, its production, and its economics. New principles for future
oil discovery depend to a large extent on an understanding of past
experience, and the recording of these data should continue until all
known producing areas have been described."
After 62 years, the authors strongly feel that
this message is still very important and pertinent and is the chief
reason for documenting this case history of the development of a
stratigraphic trap using surface soil gas geochemistry, subsurface
geology, and geophysics.
Moore-Johnson field in Greeley County, Kansas,
produces oil from a stratigraphic/structural trap involving sandstones
of the Morrow V7 incised valley-fill system. The field has a cumulative
production of 1,729,000 BO with ultimate recovery of about 2,000,000 BO.
This field is one of a complex of Morrow oil fields known as the
Stateline Trend (Figure
1). These fields in the incised valley trends of southeast
Colorado and southwest Kansas will have ultimate recoverable reserves of
about 110 MMBO.
A discussion of the regional stratigraphy,
sedimentation, structure, and petroleum geology of the Morrow Formation
is beyond the scope of this presentation. The reader is referred to
Sonnenberg et al. (1990) for a thorough discussion of these important
topics. An excellent, concise summary of this reference has been
presented by Weimer (1992, p. 977-980). Likewise, the theory,
methodology, and application of exploration soil gas geochemistry are
too lengthy to discuss, and the interested reader may pursue
Jones and Drozd (1983) or, more recently,
Jones et al. (2000).
The event which provided the opportunity to
create this case history was the release of the proprietary soil gas
 survey survey data by the owner. This release of the data fortunately occurred
around the same time as the publication of the comprehensive account
detailing the sequence stratigraphy of Morrow incised valley sandstones
and the relational aspects to reservoir geology and production
performance by Bowen and Weimer (2003). Moore-Johnson field was also
detailed in this presentation. data by the owner. This release of the data fortunately occurred
around the same time as the publication of the comprehensive account
detailing the sequence stratigraphy of Morrow incised valley sandstones
and the relational aspects to reservoir geology and production
performance by Bowen and Weimer (2003). Moore-Johnson field was also
detailed in this presentation.
There are only two published accounts of soil
gas geochemistry being used for exploration and development purposes in
the Morrow Stateline Trend. Moriarty (1990) published an account of
using single line soil gas profiles to extend Morrow production at NW
Stockholm field. Dickinson et al. (1994) published an account of a
798-site exploration reconnaissance soil gas survey conducted in 1987 on
a grid pattern over a 150-square-mile area over the north part of the
Stateline Trend. A more detailed account of this survey may be found in
LeBlanc and Jones (2004a).
The significance of this account is that it
relates a rare occurrence of a high-density, detailed soil gas survey
being conducted and used for exploitation/development purposes in the
Morrow Trend with very successful results. The authors are very aware of
the "serendipity factor" that has been a part of the Morrow oil play and
that some serendipity may have been involved in this single case
history. However, the most important point is that a documentation
process has been started that will hopefully create an awareness in the
geologic community of the advantages in using soil gas geochemistry in
Morrow exploration and development ventures.
The purposes of this presentation are to:
(1)
Document the application of a high-density soil gas survey conducted for
development purposes at Moore-Johnson field.
(2) Relate
how the geochemical data were integrated with the subsurface geology and
geophysics.
(3)
Discuss the results of the soil gas survey.
(4)
Discuss the advantages and limitations of using surface soil gas
geochemistry in the Morrow Stateline Trend.
(5)
Recommend how soil gas surveys can be further applied in the Morrow
Stateline Trend to provide risk reduction and a higher rate of return.
(6)
Recommend other areas to apply this exploration and development method.
Moore-Johnson field in Greeley County, Kansas,
was discovered by Amoco in October, 1989 (Adams, 1990). At the time of
the discovery, the Stateline Trend had been developed to the extent
shown in
Figure 2A. The Amoco Moore-Johnson #1 was the discovery well
for the field and was completed for 522 BOPD (Figure
2B and 2C). The well was completed in the sands of the V-7
valley fill sequence of the Morrow Formation. This equivalent interval
in the Morrow Formation was initially named the Stockholm Sand during
development of SW Stockholm field to the north. The sequence stratigraphy of the Morrow in relation to reservoir geology in the
vicinity of Moore-Johnson field has been more recently discussed by
Bowen and Weimer (1997, 2003).
The Amoco combined geological and seismic
conceptual model was that of a northwest-southeast-oriented Morrow sand
body (Figure
2B). The location for the discovery well was determined by
identification of the basal upper Morrow fluvial incised valley on 2-D
seismic lines supplemented by data from available well control (Adams,
1990). By May, 1990, Amoco had extended the field to include three wells
(Figure
2C). The Brewer #1 and Brewer #2 flowed at rates of 670 and 350
BOPD, respectively. In the first four months, the Moore-Johnson #1
produced 30,000 BO. This was a very significant Morrow discovery in that
it extended Morrow production for a distance of 10 miles to the south
from Second Wind field of the Stateline Trend. Amoco attempts at further
development drilling was another story, however.
As shown in
Figure
2C, attempts to extend the field to the south by Amoco
in 1990 resulted in three dry holes (Moore-Johnson #2, Linn #1, and Sell
#1). Two successful Morrow development wells were completed by Amoco to
the northwest of the discovery well in March and May, 1990 (Brewer #1,
Brewer #2). Attempts by Amoco to extend the field farther to the
northwest resulted in three more dry holes (Keller #1, Keller #2, and
Brewer #3). Amoco also drilled another dry hole to the northeast in
February, 1990, with the Lawson #1.
The overall success rate, at the end of 1990,
for development drilling in the Moore-Johnson field area was a
disappointing 33%. This was considerably below previous industry
standards in the Morrow Trend. Success rates for development of Frontera,
SW Stockholm and Second Wind fields of the Stateline Trend were 73%,
68%, and 56%, respectively. There was no further drilling in the field
area during all of 1991.
As will be
shown later in the article, had Amoco used soil gas geochemistry, in
conjunction to seismic and subsurface geology, the six dry holes could
have been avoided.
A Denver-based independent oil company decided
to explore for Morrow oil in the Stateline Trend on a regional level and
attempt to increase the drilling success rate by using surface soil gas
geochemistry. The company first purchased a reconnaissance soil gas data
set in the north part of the trend and later conducted a new detailed
soil gas survey in the south area as shown in
Figure 3A. At the time of the new survey (April, 1992),
development drilling had been completed at Second Wind field, and there
were only three development wells at Moore-Johnson field in the south.
The two combined soil gas surveys provided soil gas microseep data
consisting of 1817 samples covering a total area in the Morrow Trend of
203 square miles.
The detailed soil gas survey in the south part
of the trend, consisting of 1034 sites, was conducted over a very large
area (53 square miles) from just southeast of Second Wind field in
Cheyenne County, Colorado, to two miles south and five miles southeast
of Moore-Johnson field in Greeley County, Kansas (Figure
3A and 3B).
Realizing the limitations of the northern
reconnaissance survey spacing (11 sites per section), this company
increased the basic sample density in the southern survey to 16 sites
per section (40-acre spacing). In addition, as shown in
Figure 3B, the company already had several prospects in the
survey area and elected to increase the sample density in these areas
over the standard spacing of 16 sites per section.
The high-density soil gas survey in the
vicinity of Moore-Johnson field (Figure
3B) consisted of 106 sample sites over a four-square-mile area
(24-acre spacing). It is this area that will be the focus of this
presentation.
The purpose
of the regional detailed soil gas survey was threefold:
(1)
Calibrate the soil gas survey to the production at
Moore-Johnson field.
(2)
Aid in further exploitation and development drilling at
Moore-Johnson field.
(3)
Determine other areas along trend that exhibited similar
anomalous soil gas microseepage and therefore would have Morrow
exploration potential.
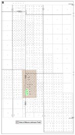
A soil gas calibration survey was first
conducted over the three-well field and in the area of the 6 dry holes
in April 1992 (Figure
4A). Because the field was being developed in 40-acre units, a
sample density of 16 sites per section was selected. An ethane-magnitude
contour map of the soil gas data in the calibration area is shown in
Figure 4A. As shown on the ethane-magnitude contour map, low
ethane magnitudes were observed in areas where the dry holes were
drilled, and the anomalous ethane values corresponded to the area of the
three Morrow oil wells. There was no problem with reservoir pressure
depletion at the time of the survey because of the limited production at
that time.
The soil-gas contour map for the calibration
survey also indicated other areas of anomalous microseepage to the east
and northeast of the three productive wells. The more detailed soil gas
survey was extended into those areas to aid in further development
drilling at Moore-Johnson field.
The initial sample grid of 16 sample sites per
section was increased with infill soil gas sites as shown in
Figure 4B. A total of 106 soil gas sites were sampled within
the map area. The infill sample data significantly increased the detail
of the microseepage anomaly pattern from that of the original
calibration survey, as evidenced by comparing the two contour maps.
Ethane magnitudes ranged from 22 ppb to 205 ppb within this area. The
ethane magnitude contour map indicated anomalous microseepage over the
Axem Resources and Murfin Drilling (Axem/Murfin) lease block in sections
2, 11, and 14.
The surface soil-gas geochemical data were next
integrated with the combined subsurface geology and seismic
interpretations.
During the first half of 1992, Axem/Murfin
integrated the combined subsurface geology and seismic interpretation
with the surface soil gas data. The conceptual model for the Morrow
trend, derived from the all the development of the northern Stateline
Trend fields, was that the Morrow section (base of Atoka to top Morrow
Limestone) was observed to thicken in the areas of maximum Morrow sand
development and productive wells. In contrast, the Morrow section was
much thinner, with non-deposition of Morrow sands, on the east and west
flanks of the Morrow fields. This was the Axem/Murfin conceptual model
for the Moore-Johnson area, interpreted from the available well control
and seismic data. The well control available at that time is shown in
Figure 5A.
Subsurface data from the 10 Amoco wells in the
area and seismic interpretation provided the Axem/Murfin concept of the
Morrow incised valley boundaries, regional dip, and general axis of the
depocenter of the Morrow valley, as indicated in
Figure 5A. Amoco had established production from two
different Morrow sands (named "A sand" and "B sand") in their three
wells. The Morrow completion zones in the three wells are indicated in
Figure 5A. Additionally, the Morrow "B sand" was encountered
in three other Amoco wells with oil shows; however, the
porosity/permeability and thickness of the sand precluded completion
attempts in those wells. The Morrow sands were not present in the other
four Amoco wells. The expected areal distribution of Morrow sands was
the interpretation shown on the map. Axem/Murfin had interpreted the
Morrow sands to be oriented north-south in the area as opposed to the
previous Amoco concept of a northwest-southeast alignment. In the new
interpretation, the Amoco productive wells were interpreted to be at the
west, updip limit of a Morrow stratigraphic trap (Figure 5A and
5C).
The interpretation of the soil gas survey data
is shown in
Figure 5B. The ethane-magnitude contour map indicated that
the maximum gas microseeps were observed in the central portion of the
expected Morrow incised valley and within the expected Morrow sand
fairway (Figure
5A and 5B). The geochemical, geological, and geophysical data
were all compatible with the conceptual model for a Morrow stratigraphic
trap.
The Axem/Murfin
acreage position was excellent. A location was staked for the Axem/Murfin
Coyote #1 in section 2. The well was spudded July 25, 1992.
Return to top.
Figure (6-11) and Table (1-2) Captions
|
 |
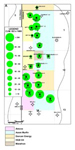
Figure 6.
Chronology of development drilling during 1992. A. Locations of
previously completed wells in Moore-Johnson field area and wells
drilled in 1992. Circled
reference numbers refer to corresponding sections in text. B.
Contour map of ethane magnitudes showing geochemical basis for
selection of development well locations. (Well locations modified
from Bowen and Weimer, 2003, and Kansas Geological Survey, 2003.) |
|
 |
Figure 7.
Chronology of development drilling during 1993 and 1994. A.
Locations of previously completed wells in Moore-Johnson field area
and wells drilled in 1993 and 1994. Circled reference numbers refer
to corresponding sections in text. B. Contour map of ethane
magnitudes showing geochemical basis for selection of development
well locations. (Well locations
modified from Bowen and Weimer, 2003, and Kansas Geological Survey,
2003.) |
|

 |
Figure 8.
Subsurface geology and reservoir parameters of Moore-Johnson field.
A. Areal distribution of Morrow V7 reservoir sandstones within
incised valley. Note sequence of deposition, ranges in thickness,
and width of Morrow V7b, V7c, and V7d valley sequences. B.
Stratigraphic nomenclature of Morrow formation in eastern Colorado
and western Kansas; overlying and underlying formations also
indicated. Type log for Stateline Trend. C. Structural cross section
A-A' depicting both stratigraphic and structural elements
contributing to entrapment of hydrocarbons at Moore-Johnson field
(with well control from development
drilling through 1994) . Location of cross section in Figure 8A.
(Modified from Bowen and Weimer, 2003.) |
|
 |
Figure 9. Oil production from
Moore-Johnson field. A. Variation in cumulative production from
individual leases and wells. Dot size is proportional to cumulative
oil volumes. B. Annual oil production from 1990 to 2003 for north
leases. C. Annual oil production from 1990 to 2003 for Moore-Johnson
leases. D. Annual oil production from 1990 to 2003 for entire field.
E. Cumulative production for field from 1990 to 2003. (Annual oil
production data for field and leases from Kansas Geological Survey,
2003.) |
|
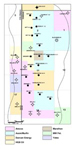 |
Figure 10. Well status and lease
blocks for oil companies involved in development of Moore-Johnson
field from 1989 to 1994. Thirty-four wells were drilled to define
and develop the field. |
|
 |
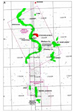
Figure 11.
Summary of results of multi-disciplined approach for development of
Moore-Johnson field. A. Ethane-magnitude contour map. Note locations
of dry holes in areas of ethane background concentrations. B. Areal extent of Morrow
V7 sandstone reservoirs at Moore-Johnson field. C. Cumulative
production from wells in Moore-Johnson field. |
|
 |
Table
1. Moore-Johnson field parameters (data from multiple sources but
chiefly from Adams, 1990). |
|
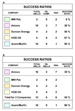 |
Table
2. Success ratios for oil companies involved in development of
Moore-Johnson field. A. Success ratios for all oil companies. B.
Success ratios for groups drilling ten or more wells. |
|
|
Click to view comparison of two
vintages of maps depicting reservoir
distribution (Figure 2B, 8A), maps prepared from two soil gas surveys
(Figures 4A, 4B), and production map (Figure 9A). |
|
|
Click
to view sequence of maps showing field development (Figures 2C, 6A,
7A). |
|
|
Click
to view sequence of maps that allow comparison of field development
and the results of the detailed soil gas survey (Figures 4B, 6B,
7B). |
Eleven wells were drilled in 1992 by 5 oil
companies (Figure
6A). Only Axem/Murfin used the integrated approach of soil gas
geochemistry with geology and seismic to select well locations. The
locations of the wells drilled in 1992 are shown in
Figure
6A. An ethane-magnitude contour map (Figure
6B) illustrates the geochemical basis of Axem/Murfin decisions
in selecting well sites. The following is the order in which the 1992
wells were drilled:
1. In April and May, 1992, MW Pet. drilled two Morrow dry holes with the
Brewer #24-2 and Sell #13-31 wells. Both wells were 4000-foot step-outs.
Both well locations are in areas of background soil gas concentrations.
No further wells were drilled by this company in this area.
2. In August, 1992, Axem/Murfin drilled their first well and completed
the Coyote # 1 as a Morrow oil well (Figure
6A and 6B). This was a very significant well in that it was a
4700-foot stepout extension for Moore-Johnson field. The well location
was supported by a strong soil gas anomaly. The well confirmed the
conceptual model established by integrating geochemistry with geology
and geophysics.
3. Duncan Energy completed two direct offsets in October and November to
the Amoco Brewer #1 and #2 producing Morrow wells. These two wells were
only 1500-foot offset locations.
4. In November, 1992, Axem/Murfin completed two Morrow wells with the
Wendleburg #1-11 and Blackbird #1 wells. The Wendleburg #1-11 location
was supported by a strong soil gas anomaly.
5. In December, 1992, HGB Oil completed the Brewer #1 as a Morrow oil
well. This location had been proven by the existing surrounding wells to
the west, east, and south.
6. HGB Oil, Yates, and Duncan Energy each drilled a Morrow dry hole in
Colorado attempting to extend field production updip and to the west.
There were now five dry holes in Colorado to the west of the field. All
five well locations are in areas of low-magnitude soil gas data.
By the end
of 1992, Moore-Johnson field had produced 512,714 BO.
The locations of all the wells previously
drilled through 1992 are shown on
Figure 7A. An ethane-magnitude contour map (Figure
7B) illustrates the basis of Axem/Murfin decisions in selecting
well sites. The following are the 1993 wells that were drilled:
1. Marathon completed the Wendleburg #2-11 as a Morrow oil well in
February, 1993. This well was a direct offset to the Axem/Murfin
Wendleburg #1-11 drilled three months previously in November, 1992. This
was the only lease Marathon held in the field area.
2. HGB Oil drilled three Morrow oil completions from March through July,
1993 (Witt #A2, Witt #B1, Brewer #2). The wells were on the updip, west
side of the field. The Witt #B1 only produced 1745 BO and is considered
to be a dry hole.
3. Axem/Murfin drilled three Morrow oil wells in the north area with the
Bobcat #1-2, Coyote #2, and Wendleburg #3-11. The Bobcat and Wendleburg
well locations were in areas of anomalous microseeps.
4. Axem/Murfin drilled two Morrow oil wells in the south area with the
Mooore-Johnson #3 and Moore-Johnson #4 wells. The Moore-Johnson #3 well
was completed in August, 1993, and was located in an area of anomalous
ethane concentrations.
By the end of 1993, Moore-Johnson field contained 17 Morrow oil wells
and extended for 11,000 feet in a north-south direction and 3000 feet in
width. Axem/Murfin had completed seven successful Morrow wells without a
dry hole. At the end of 1993, cumulative production at the field was
780,549 BO.
In 1994, four wells were drilled by three oil
companies in the north area of the field. The following are the 1994
wells that were drilled:
5. HGB Oil drilled the Witt #A1 as a Morrow oil well in January, 1994.
The well location was on trend and 1500 feet from their Witt #A2
completion 6 months earlier.
6. Axem/Murfin drilled their first dry hole in the Bobcat #2-2 in
January, 1994. A 700-foot offset to the southwest, however, resulted in
a Morrow oil completion. The Bobcat lease, to date, has produced a total
cumulative of 170,646 BO from two wells.
7. Duncan Energy completed a marginal Morrow well with the Lang #34-35
in March, 1994. After only producing 477 BO, the well was converted to
an injection well. Moore-Johnson field was fully defined by 34 wells.
The major extension of the field only took 24 months. This is one of the
shortest development periods for a comparative size field in the whole
Morrow trend.
By the end
of 1994, the cumulative production from the 19 Morrow wells in
Moore-Johnson field was 980,152 BO.
Moore-Johnson field (Figure
8A, 8B, and
8C) has been discussed by Adams (1990) and more recently by
Bowen and Weimer (1997, 2003). These last two papers document the Morrow
sequence stratigraphic framework throughout the trend and relate it to
the subsurface geology, reservoir geometry, and reservoir performance at
Moore-Johnson field.
The reservoir sands at Moore-Johnson field were
deposited as fluvial valley-fill deposits in a valley incised into the
Morrow Limestone (Figure
8C). These Morrow sands have been correlated regionally to the
Morrow V7 valley sequence (Figure
8B). The areal distribution of the three reservoir sands
deposited within the incised valley is shown in
Figure 8A. From oldest to youngest, the order of deposition
was V7b, V7c, V7d valley fill-sequences.
Structural cross section A-A' (Figure
8C) depicts the positions of the three valley-fill sequences
with respect to depth. Regional dip is to the east-southeast. The
various Morrow reservoirs were encountered at depths ranging from 5100
to 5150 feet. Initial reservoir pressure was 1040 psi. Other reservoir
parameters are shown in
Table 1.
The three reservoir sand bodies are
predominantly lateral to each other and are rarely incised into one
another, as is the case in the northern fields. Generally, the three
sand bodies are completely encased in estuarine shales (Figure
8C). Porosities range from 14% to 28%, with permeabilities from
22 to 9,990 md (Adams, 1990). The GOR was 107:1 (cu ft/bbl). Other field
parameters are listed in
Table 1.
Compared to the V7 valley fill reservoirs in
northern fields, the reservoirs at Moore-Johnson are narrower in cross
section (see legend,
Figure 8A) and of smaller extent and more compartmentalized
due to the dominant shale facies. Because of these conditions, oil
columns are thinner and production values are somewhat lower; however,
drainage efficiency is high (Bowen and Weimer, 2003). Recovery factors
are variable due to, in some cases, problems with pressure maintenance.
Oil volumes
produced to date from individual wells range from 32,000 BO to over
230,000 BO. The field-wide average, to date, for the 19 wells is 91,000
BO per well. These per well averages are better than the average values
at Castle Peak, Harker Ranch, SW Stockholm, and Jace fields, reported by
Bowen and Weimer (2003).
Production for Moore-Johnson field is reported
by the
Kansas Geological Survey (KGS). Cumulative production is
reported by lease and not individual wells. To attempt to show variation
in production in the individual wells, the lease production totals were
divided by the appropriate number of wells in each lease.
Figure 9A illustrates the variation in production among all
the wells. Note the differences in cumulative production between the
Witt "A" and Bobcat leases in the north part of the field.
Annual production for the northern leases
(Witt, Bobcat, Coyote, Brewer, Wendleburg and Huddleston) is shown in
Figure 9B. The peak in production from 1992 to 1995 reflects
the addition of the new development wells. Annual production volumes for
the Moore-Johnson lease are shown in
Figure 9C. The peak in production from 1994 to 1998 reflects
the addition of the Axem/Murfin Moore-Johnson #3 and #4 wells. Annual
production volumes for the entire field are shown in
Figure 9D. Total production for the field in 2002 was 45,000
BO. Since 1997, annual production volumes have been declining at a rate
of about 15% per year.
The field was unitized in 1995 for pressure
maintenance by gas and water re-injection. Effects of secondary recovery
operations in the north leases, beginning in 1998, are shown in
Figure 9B and for the south lease in 1999 in
Figure 9C.
Cumulative production for the field is shown in
Figure 9E. The year-to-date total production for the field is
1,729,000 BO. Average per well production for the 19 wells in the field
is 91,000 BO. Average-per-well production for the eight Axem/Murfin
wells is 93,750 BO.
The
KGS reported seven wells still producing in 2003. Ultimate
recoverable reserves for the field will be about 2,000,000 BO.
The major advantage of using detailed soil gas
surveys for exploitation/development drilling is to increase the success
rate (risk reduction). A total of 34 wells were drilled both to define
the limits of the field and to develop the Morrow reserves in
Moore-Johnson field, culminating with 19 producing wells and 15 dry
holes (Figure
10). An initially completed well at the north end of the field
(Lang #34-35) was a marginal well (447 BO) which was converted to an
injection well and later into a salt water disposal well and is
considered as a dry hole. This represents an overall success rate of
56%, which at the end of 1994, was on the low side of the industry
average in the Morrow Trend.
To characterize the success rate at this field
in this way is somewhat misleading. The drilling statistics are severely
hampered by the dismal Amoco success rate of 30% and, on the other hand,
strengthened by the exceptional Axem Resources and Murfin Drilling
success rate of 90%. A better way of characterizing the success rate at
Moore-Johnson field is to look at the individual drilling statistics of
five companies. The major lease blocks held by the operators in the
field, along with the completed wells, is shown in
Figure
10. Marathon and Yates each drilled only one Morrow
oil well and one dry hole, respectively, in the field area, and the
associated data are not discussed further.
As shown in
Table 2A, the success rates for the six companies that
drilled at least two wells ranged from 0% (MW Pet.) to 50% (Duncan
Energy) to 90% for Axem/Murfin. The chief reason for the high success
rate of Axem/Murfin was that they used an integrated approach of surface
geochemistry, subsurface geology, and geophysics.
This analysis, however, uses widely varying
populations of drilled wells. If the Duncan Energy, MW Pet., and HGB Oil
wells are grouped together, then an even comparison can be made to Axem/Murfin
and Amoco with the groups each having drilled 10 or 12 wells. As
Table 2B indicates, Amoco and the Duncan - HGB Oil - MW Pet.
group had a success rates of 30% and 50%, respectively, (without using
geochemistry) and the Axem/Murfin group had a 90% success rate.
Axem/Murfin drilled nine successful Morrow
wells that accounted for 47% of the total Morrow oil wells in the field.
HGB Oil and Duncan Energy both gained valuable subsurface control from
these Axem/Murfin wells; this ultimately helped increase their success
rate. The Axem/Murfin Coyote #1 and Wendleburg #1-11 were very early
Morrow completions that greatly aided HGB Oil in evaluating their
southern leases.
Besides
discussing success rates, the benefits of using surface soil gas
geochemistry can also be illustrated by considering discovered oil
reserves. By drilling 10 wells Duncan Energy and HGB Oil had a
cumulative production (to 2003) of 418,429 BO. By drilling the same
number of wells, Axem/Murfin wells had produced 749,800 BO. This is
almost twice as much production. By drilling only 29% of the total wells
(34), Axem/Murfin wells, to date, have produced 47% of the produced
reserves. The ultimate recoverable reserves for Moore-Johnson field are
estimated at 2,000,000 BO.
As previously discussed, the major advantage of
soil gas surveys in the Morrow oil trend is that of risk reduction, or,
improving the success ratio. As shown on the
Figure 11A, had the survey been available to all companies,
then obviously, 11 of the dry holes on the west side and the north and
south end of the field would not have been drilled. This alone would
have increased the overall success rate for the field from 56% to 82%.
Had the data been available to Amoco in 1990, at least five of the dry
holes could have been avoided increasing Amoco's success rate from 30%
to 60%.
Another major advantage of soil gas surveys is
the relatively low cost. Considering sample collection, laboratory
analyses, and interpretation and reporting costs, the present-day cost
of the 106 site soil gas survey conducted at Moore-Johnson field would
be about $14,000. This is only about 15% of the dry hole cost of a
single Morrow well.
In this portion of the Morrow trend, the sample
density of 16 sites per section is only adequate for defining a lead or
prospect area and possibly acquiring acreage. This sample density is not
adequate for exploitation or development drilling. A sample density of
at least 30 sites per section is needed (Figure
11A), as was shown at Moore-Johnson field (LeBlanc
and Jones, 2004a).
Surface soil gas geochemistry will not
eliminate all dry holes being drilled within a field. The example of the
previously discussed Bobcat #2-2 wells is a good example to illustrate
this point. As pointed out by Bowen and Weimer (2003), the V7 sands in
this part of the Morrow trend are of smaller areal extent, smaller in
cross section, and more compartmentalized than in the Morrow fields to
the north. At the sample density of this survey, microseep anomaly
patterns could not distinguish the individual trends of the V7b, V7c,
and V7d reservoirs. This is because the widths only range from 1800 to
3000 feet (see legend,
Figure 11B). Perhaps a denser soil gas grid may have provided
the necessary resolution.
Soil gas anomaly data cannot distinguish
between oil reservoirs of different geologic ages. In this part of the
Morrow trend, in most wells the Mississippian has been a secondary (or
primary) objective. Although not productive at Moore-Johnson field,
anomalous microseeps in the surrounding area could indicate
Mississippian potential in addition to Morrow. Additionally, shows were
reported in some wells in the Pennsylvanian Lansing-Kansas City
interval.
There is no
direct relationship between the magnitudes of microseeps and either the
rate or total volume of hydrocarbons a well will produce except in a
very general sense. As can be seen comparing the ethane contour map (Figure
11A) to the production map (Figure
11C), the Bobcat lease (170,646 BO) has been more productive
than the Witt "A" lease (90,575 BO) and the Lang lease (477 BO).
Similarly, the Coyote lease (95,362 BO) has been more productive than
the Witt "B" lease (1745 BO). The ethane magnitudes suggest differences
that may be related to these production volumes. This suggests that the
amount of reserves on a prospect could likely be improved by a company
getting a competitive edge in early lease acquisitions based on soil gas
data. One of the reasons that Axem/Murfin had such sizeable reserves at
Moore-Johnson field was their excellent lease position.
Return to top.
Figure 12 and
Table 3 list success rates for development drilling in
representative fields in the Morrow oil trend and other factors (years
to develop, per well reserves) affecting the rate of return in the
Morrow trend. The fields are grouped according to the facies tracts as
defined by Bowen and Weimer (2003). It is apparent that the newer fields
most recently developed (Jace, Sunflower, Sidney) have the lowest
success rates. As shown at Moore-Johnson field, high-density soil gas
surveys could improve drilling success in these areas. Employment of
soil gas surveys could also have accelerated the development drilling
schedule at Sorrento and SW Stockholm fields from the 10-year period
that was required for full field development. As discussed by Bowen et
al. (1993), initially (1979 to 1984) an incorrect depositional model was
the main reason for the rather lengthy development time frame at these
two fields.
Success rates for Morrow exploration wells were
reported by Bowen et al. (1993) to have been 5% in the Sorrento-Mt.
Pearl-Sianna area and reported by Moriarty (1990) to have been 10% in
the Stateline area. There still remain areas of untested Morrow
exploration potential in the transitional and updip facies tracts where
soil gas surveys could be employed to improve the exploratory success
rates over those previously reported. Regional isopach maps of the upper
Morrow section have been used to define other areas where Morrow V1, V3,
and V7 incised valleys might exist (Bowen and Weimer, 2003, Figure 10).
Regional soil gas surveys could be very useful in exploration ventures
when used in conjunction with this method, especially in areas with
sparse well control (LeBlanc
and Jones, 2004a).
As shown in this presentation, surface soil gas
geochemistry has been successfully used in developing oil reserves in
the Morrow V7 incised valley trend. This method would also be applicable
in other Morrow incised valley trends of southeast Colorado and
southwest Kansas, such as the V1 and V3 valley systems. As reported by
Bowen and Weimer (1997, 2003), these two incised valley systems are
transparent on 2-D or 3-D seismic due to their close proximity to the
base of Atoka/top of Morrow interface. Additionally, other Morrow
incised valley fill systems were outlined by Wheeler et al. (1990) in
Wallace County, Kansas, and farther south in Kiowa, Brent, and Powers
counties, Colorado.
A high degree of compartmentalization has been
observed in the V7 reservoirs in the downdip facies tract. Future soil
gas surveys in this area, for development drilling purposes, should have
a higher density of samples than the grid of 30 sites per section used
in the 1992 survey at Moore-Johnson field. For regional exploration
activities in the Morrow trend, a soil gas grid of 16 sites per section
appears satisfactory only for delineating regional microseep anomalies.
Soil gas geochemistry would also be applicable
in other younger Pennsylvanian incised valley systems that have been
identified in central and southern Kansas and northern Oklahoma (Kansas
Geological Society, 2003). Likewise, Cretaceous-age incised valley-fill
systems exist in Rocky Mountain areas, such as the Denver, Powder River,
and Williston basins. The generalized paleodrainage network for the
Muddy Formation was illustrated by Weimer (1992, Figure 3) over northern
Colorado, Wyoming, and eastern Montana areas. A more detailed picture of
paleovalleys in the Denver basin that were filled with Muddy valley-fill
sandstones was also presented.
The advantages of using each of the disciplines
of geology, geophysics, and soil gas geochemistry in Morrow exploration
and development are well known; however, the three disciplines have
seldom been used in tandem. A somewhat lesser discussed topic is that of
the limitations of these three sciences.
The limitations of using soil gas surveys in
the Morrow oil trend have been discussed, to some extent, in this
presentation. Bowen et al. (1993) discussed limitations of subsurface
geology and 2-D seismic in locating reservoir quality sandstones in the
Sorrento-Mt. Pearl-Sianna area. Germinario et al. (1995) likewise
discussed the limitations of 2-D and 3-D seismic surveys in locating
both the incised valleys and reservoir sandstones in the southern
Stateline Trend.
The
integrated, multidisciplined approach of using geology, geophysics, and
soil gas geochemistry in Morrow exploration (LeBlanc and Jones, 2004b)
is a superior method whereby the advantages in one of the three
disciplines complement and overcome the limitations or shortcomings of
another.
A high-density soil gas survey was conducted in
the vicinity of Moore-Johnson field in 1992. The survey was conducted
after discovery of the field and initial development attempts, all by
the same major oil company, resulted in a total of 10 wells (3 oil
wells, 7 D&A). A second attempt to extend the field, starting in 1992,
was conducted by six independent oil companies. One of the companies
used an integrated approach of combining subsurface geology and seismic
with a detailed geochemical soil gas survey. The remainder of the
companies used industry-standard Morrow exploration techniques acquired
from 1978 to 1990 during development of Morrow oil fields to the north.
A high-density soil gas survey, consisting of
106 sites, was conducted over a four-square-mile area of interest.
Integration of geochemistry, geology, and geophysics resulted in a
compatible, unified interpretation that the field could be extended to
the north.
The company utilizing the soil gas survey
completed the first well to extend the field with a 4700-foot stepout.
This company completed eight consecutive successful Morrow wells in the
field before drilling a dry hole. After drilling 10 wells, the company
had a 90% success rate. A total of 34 wells were drilled to define the
limits of the field and develop the Morrow reserves. By only drilling
29% of the total wells, the company utilizing soil gas geochemistry
acquired 47% of the reserves produced to date. Success rates for the
remainder of the other field operators were 0%, 30%, 50% and 67%,
respectively.
There are still areas of untested potential in
the Morrow oil trend. Fields discovered to date have produced 66.5 MMBO,
with ultimate recoverable reserves estimated at about 110 MMBO. Fields
in the southern portion of the trend are in the downdip facies tract as
characterized by Bowen and Weimer (2003). The Morrow sands in these
wider incised valleys are of smaller areal extent, smaller in cross
section, and more compartmentalized. Correspondingly, the average
reserves per well are smaller than the northern fields. Although
reserves are lower in the downdip facies, employing soil gas
geochemistry can improve the relatively low success rates now being
encountered in this area. This could vastly improve the rate of return.
This documentation of a successful application
of a detail soil gas survey demonstrates how the method could be used to
delineate other areas of Morrow incised valley-fill systems in areas of
untested potential. Additionally, the method would also be applicable in
incised valley-fill systems of other geologic ages in Midcontinent and
Rocky Mountain basins.
Soil gas geochemistry is not a panacea for
Morrow exploration, exploitation, or development drilling, but is an
integral part of a thorough exploration program. Applying the recently
related concepts of Morrow sequence stratigraphy will undoubtedly be a
tremendous advantage in future Morrow exploration and development
drilling ventures, reservoir maintenance, and in secondary recovery
operations. Using soil gas geochemistry in tandem with this concept
would provide a very powerful synergistic effect to Morrow exploration
and development projects.
Adams, C.W., 1990, Jace and Moore-Johnson fields, in
Sonnenberg, S.A., L.T. Shannon, K. Rader, W.F. Von Drehle, and G.W.
Martin, eds., Morrow sandstones of southeast Colorado and adjacent
areas: Rocky Mountain Assoc. of Geologists, p. 157-164.
Bowen, D.W., and P. Weimer, 1997, Reservoir geology of
incised valley-fill sandstones of the Pennsylvanian Morrow Formation,
southern Stateline trend, Colorado and Kansas, in K.W. Shanley
and B.F. Perkins, eds., Shallow marine and nonmarine reservoirs,
sequence stratigraphy, reservoir architecture, and production
characteristics: Gulf Coast Section, SEPM Annual Research Conference
Transactions, v. 18, p. 55-66.
Bowen, D.W., and P. Weimer, 2003, Regional sequence
stratigrapic setting and reservoir geology of Morrow incised-valley
sandstones (lower Pennsylvanian), eastern Colorado and western Kansas:
AAPG Bulletin, v. 87, p. 781-815.
Bowen, D.W., P. Weimer, and A.J. Scott, 1993, The
relative success of siliciclastic sequence stratigraphic concepts in
exploration: examples from incised valley fill and turbidite systems
reservoirs, in P. Weimer and H. Posamentier, eds., Siliciclastic
sequence stratigraphy: AAPG Memoir 58, p. 15-42.
Dickinson, Roger, D.A Uhl, M.D. Matthews, R.J. LeBlanc,
Jr., and V.T Jones, 1994, A retrospective analysis of a soil gas survey
over a stratigraphic trap trend on the Kansas-Colorado border: AAPG
Hedberg Research Conference, Near-surface expression of hydrocarbon
migration, April 24-28, 1994, Vancouver, British Columbia, Canada.
Poster Session IV, April 27, 1994.
Germinario, M.P., S.R. Cronin, and J.R. Suydam, 1995,
Applications of 3-D seismic on Morrow channel sandstones, Second Wind
and Jace fields, Cheyenne and Kiowa Counties, Colorado, in R.R.
Ray, ed., High definition seismic 2-D, 2-D swath, and 3-D case
histories, Rocky Mountain Assoc. of Geologists, p. 101-119.
Jones, V.T.,
and R.J. Drozd, 1983, Predictions of oil or gas potential by
near-surface geochemistry: AAPG Bulletin, v. 67, no. 6, p. 932-952.
Jones, V.T.,
M.D. Matthews, and D.M. Richers, 2000, Light hydrocarbon for petroleum
and gas prospecting, in M. Hale, ed., Handbook of exploration
geochemistry, v. 7, Elsevier Science, p. 133-212.
Kansas Geologic Survey, 2003, Oil production for
Moore-Johnson field (http://www.kgs.ku.edu/).
LeBlanc,
Jr., R.J., and V.T. Jones, 2004a, How to design an exploration surface
soil gas geochemical survey : Illustrated by application examples from
the Hugoton Embayment of SE Colorado and SW Kansas (abstract): AAPG
Annual Meeting, April 18-21, 2004, Dallas Texas. : Illustrated by application examples from
the Hugoton Embayment of SE Colorado and SW Kansas (abstract): AAPG
Annual Meeting, April 18-21, 2004, Dallas Texas.
LeBlanc, Jr., R.J., and V.T. Jones, 2004b, Criteria for a
multi-disciplined approach for exploration, exploitation, and
development drilling in the Morrow incised-valley oil trend of Colorado
and Kansas: The 3-G method (abstract): Rocky Mountain Section AAPG
Meeting, August 9-11, 2004, Denver, Colorado.
Moriarty, B.J., 1990, Stockholm Northwest extension,
effective integration of geochemical, geological, and seismic data,
in Sonnenberg, S.A., L.T. Shannon, K. Rader, W.F. Von Drehle, and
G.W. Martin, eds., Morrow sandstones of southeast Colorado and adjacent
areas: Rocky Mountain Assoc. of Geologists, p. 143-152.
Sonnenberg, S.A., L.T. Shannon, K. Rader, W.F. Von Drehle,
and G.W. Martin, eds.,1990, Morrow sandstones of southeast Colorado and
adjacent areas: Rocky Mountain Assoc. of Geologists, 263 p.
Weimer, R.J., 1992, Developments in sequence stratigraphy:
foreland and cratonic basins: AAPG Bulletin, v. 76, no. 7, p. 965-982.
Wheeler, D.M., A.J. Scott, V.J. Coringrato, and P.E.
Devine, 1990, Stratigraphy and depositional history of the Morrow
formation, southeast Colorado and southwest Kansas, in Sonnenberg,
S.A., L.T. Shannon, K. Rader, W.F. Von Drehle, and G.W. Martin, eds.,
Morrow sandstones of southeast Colorado and adjacent areas: Rocky
Mountain Assoc. of Geologists, p. 9-35.
First and foremost we are indebted to Olga
Sandria-O'Neal for her many suggestions that vastly improved the
illustrations in this presentation and for her patience in the many
revisions of the superb CAD graphics that are contained in this
presentation. The stimulus for this presentation was the outstanding
contributions made by the cited authors, predominantly over the past
decade, on the stratigraphy and petroleum geology of the area. More
specifically, we have relied heavily on the more recent publications of
David W. Bowen and Paul Weimer. This discussion of surface soil gas
geochemistry applications in the Hugoton Enbayment is not only the
result of the authors’ geochemical investigations and interpretations in
the area over a 16-year period but also is the result of discussions
with, and contributions from, many of our colleagues - both past and
present over a 20-year period. Special thanks are due to Rod Eichler,
former VP of Exploration for Axem Resources, Inc., who had the vision
and foresight to implement and guide an integrated exploration and
development program, in the Morrow Stateline Trend, that created the
extensive soil gas database used in this presentation. Thanks are also
extended to Matt Matthews, John W. Shelton, and Rufus J. LeBlanc, Sr.
for reviewing various drafts of the manuscript. Gratitude is also
extended to Westport Oil & Gas Co. for releasing the proprietary soil
gas data.
Return to top.
|


