Click on image for enlargement.
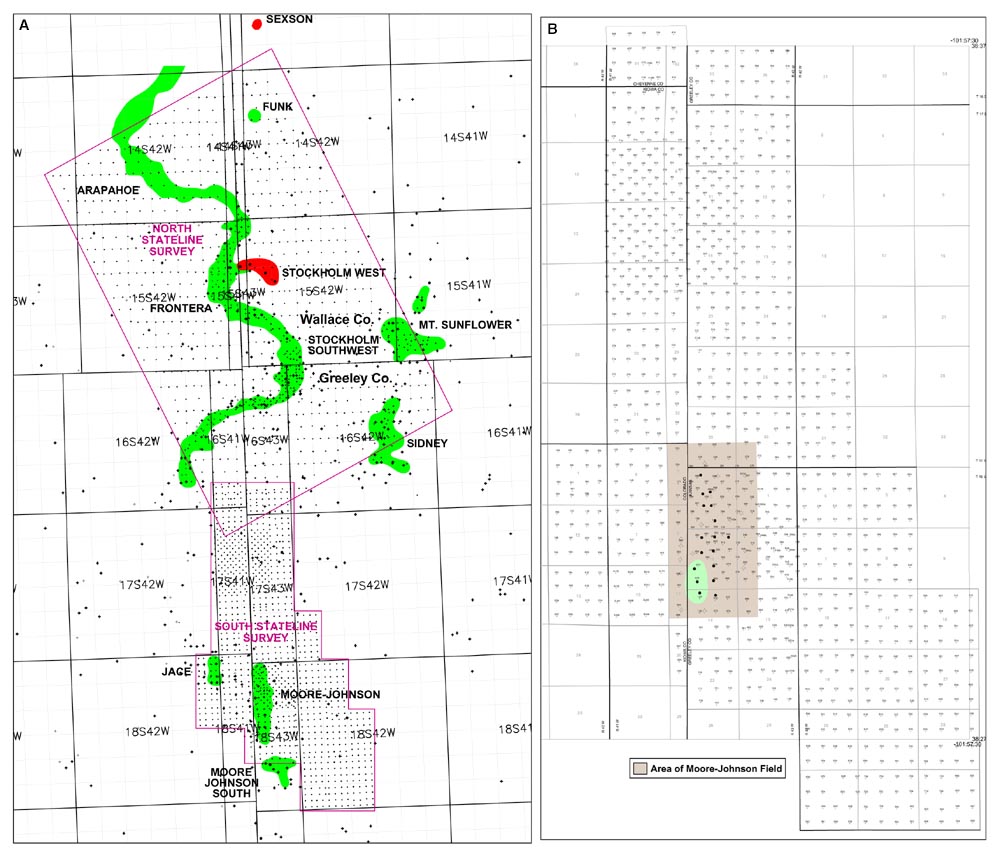
Figure 3. Location maps of regional ![]() soil
soil![]() gas survey grids. A. Location of
north and south regional
gas survey grids. A. Location of
north and south regional ![]() soil
soil![]() gas surveys in Morrow oil trend with respect to
oil fields in the Stateline Trend. B. Detail of south Stateline Trend
gas surveys in Morrow oil trend with respect to
oil fields in the Stateline Trend. B. Detail of south Stateline Trend ![]() soil
soil![]() gas
survey showing locations of
gas
survey showing locations of ![]() soil
soil![]() gas sample sites. Area of high-density
gas sample sites. Area of high-density ![]() soil
soil![]() gas
survey in Moore-Johnson field area.
gas
survey in Moore-Johnson field area.