Click on image for enlargement.
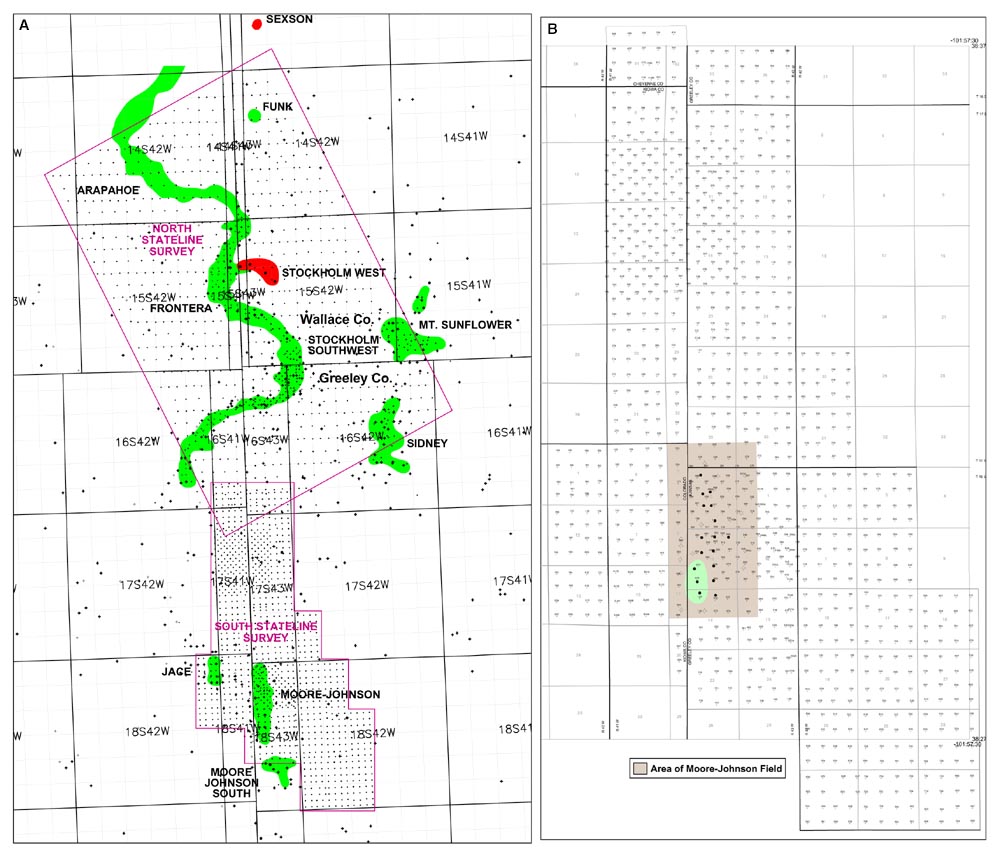
Figure 3. Location maps of regional soil ![]() gas
gas![]() survey grids. A. Location of
north and south regional soil
survey grids. A. Location of
north and south regional soil ![]() gas
gas![]() surveys in Morrow
surveys in Morrow ![]() oil
oil![]() trend with respect to
trend with respect to
![]() oil
oil![]() fields in the Stateline Trend. B. Detail of south Stateline Trend soil
fields in the Stateline Trend. B. Detail of south Stateline Trend soil ![]() gas
gas![]() survey showing locations of soil
survey showing locations of soil ![]() gas
gas![]() sample sites. Area of high-density soil
sample sites. Area of high-density soil ![]() gas
gas![]() survey in Moore-Johnson field area.
survey in Moore-Johnson field area.