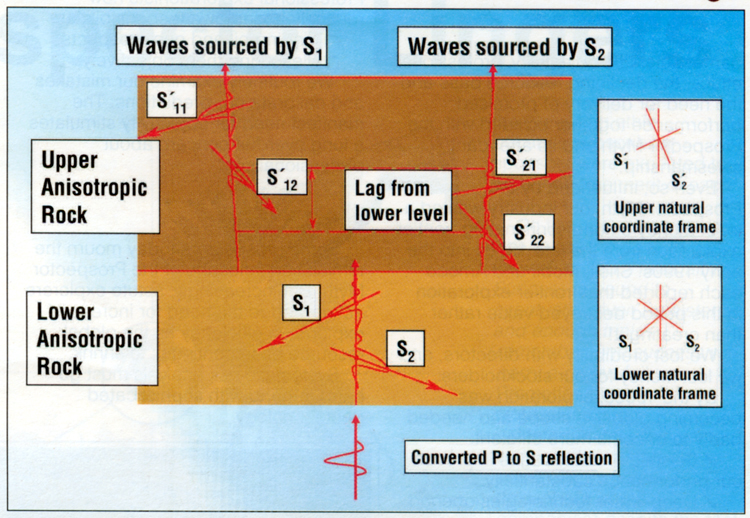
Figure 6. Diagram of upgoing PS-waves, showing that the separate fast and slow waves produced by the initial PS-wave in the first (lower) anisotropic layer encountered can split again within the next (upper) anisotropic layer above. The various split S-wave modes are combined when detected by the two horizontal geophones and must be unraveled by layer-stripping to estimate the azimuthal anisotropy (fracture properties).