 Click to view article as PDF
GCSeismic/Geology Links Critical*
By
Alistair R. Brown
Search and Discovery Article #40130 (2004)
*Adapted for online presentation from article of the same title by the same author in Geophysical Corner, AAPG Explorer, November, 1996. Appreciation is expressed to the author and to M. Ray Thomasson, former Chairman of the AAPG Geophysical Integration Committee, and Larry Nation, AAPG Communications Director, for their support of this online version.
1Consulting reservoir geophysicist, Dallas Texas ([email protected])
Seismic data today, particularly 3-D, contain a great amount of information and can yield maps of considerable accuracy. All seismic information, however, is relative, so to give it the greatest possible accuracy we must calibrate it to the local geology.
Since seismic data
respond to the acoustic properties of rocks, the geology needs to be expressed
in some comparable form. Thus sonic (acoustic) logs and density logs from wells
have become the established form of subsurface information used for making
seismic ![]() ties
ties![]() .
.
In this article,
we shall review the traditional technique for tying ![]() well
well![]() logs - and thus the
rocks penetrated by the
logs - and thus the
rocks penetrated by the ![]() well
well![]() - to seismic data.
- to seismic data.
|
uTying
uTying
uTying
uTying
|
Tying
Assuming
we have both a sonic log (A) and a density log (B), they are multiplied
together point-by-point to give an acoustic impedance log (C,
Figure 1).
This is converted from depth to time using some velocity function. By
subtracting one acoustic impedance value from another progressively down
the log, now in time, we obtain acoustic impedance contrasts, which are
a direct expression of seismic reflectivity (D). This is a series of
spikes, which implies a very high frequency content; this is, of course,
what we expect, because the information came directly from
Seismic
data have a lower frequency content because the energy has traveled from
the surface and back again. Because of this lower frequency content, the
seismic energy pulse is rather broad. Some estimate of the shape of this
pulse, or
The
superimposition of the resulting many wavelets provides the synthetic
seismic trace, or synthetic seismogram (F). This is compared to the real
seismic trace at the Because of velocity error, some relative sliding up and down may be necessary to help the match. In this way we transfer some geological identity onto the seismic section. Although this is a time-honored approach, the similarity between the synthetic seismogram and the seismic trace is often poor - leaving considerable uncertainty as to how to make the match. The causes of these dissimilarities and difficulties are not simple and may include the information given below.
The tying
of
1. The
seismic Polarity. Phase. Frequency content.
Synthetic
seismograms are commonly made with both polarities so that polarity
errors should be recognized - but with a poor match, an all too common
event, they may not be. Experiments with different frequency contents
are commonly conducted to help the character match. However, we often do
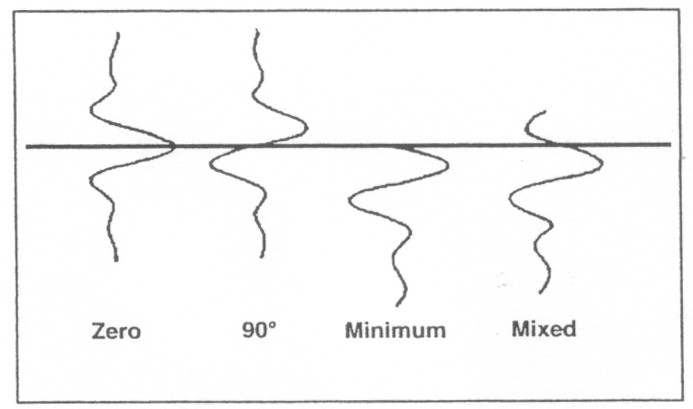
not properly consider phase. We assume the data is zero phase - and
perhaps it is not. A zero phase (symmetrical)
2.
3. Seismic
data and
4. There
may be significant positioning errors of either the
All this,
of course, affects which seismic trace should be used for the 5. Amplitude-Variation-with-Offset (AVO) effects in the data before stacking may mean that the stacked output trace which we are trying to tie has amplitudes that are fundamentally wrong.
1. In addition to questioning polarity and frequency content, we should think critically about data phase. We should not necessarily believe the data phase is what it is supposed to be, but rather we should analyze the phase to our own satisfaction. This can be done analytically or interpretively - and different people prefer different approaches.
Knowledge
of the data phase tells us the
2. We
should try to use modern
3. The
difference in resolution between seismic data and
4. We
should question the location of each
5. AVO
effects cannot be comprehended for normal stacked data. In the future
more |