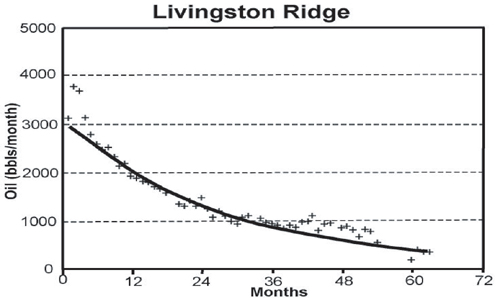
Figure 2.5. Graph of monthly oil production from the average well that produces from Livingston Ridge Brushy Canyon reservoir, showing extent of decline in production during a five-year period (from Broadhead et al., 1998).
Figure 2.5. Graph of monthly oil production from the average well that produces from Livingston Ridge Brushy Canyon reservoir, showing extent of decline in production during a five-year period (from Broadhead et al., 1998).