Click on desired image for enlargement.
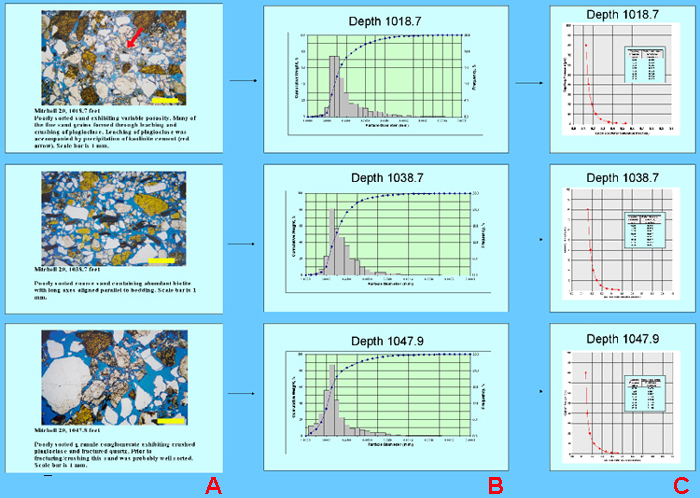
Figure 11. Photomicrographs of samples of KRF in MIT0020 (A), corresponding particle-size analyses (B), and capillary-pressure data (C). A.1. Poorly sorted sand exhibiting variable porosity. Many of the fine sand grains formed through leaching and crushing of plagioclase. Leaching of plagioclase was accompanied by precipitation of kaolinite cement (red arrow). Scale bar is 1 mm. A.2. Poorly sorted coarse sand containing abundant biotite with long axes aligned parallel to bedding. Scale bar is 1 mm. A.3. Poorly sorted granule conglomerate exhibiting crushed plagioclase and fractured quartz. Prior to fracturing/crushing this sand was probably well sorted. Scale bar is 1 mm. B. Laser particle-size analysis shows unimodal distributions for all three samples and a fining-upward sequence. C. Capillary-pressure data indicate that the Swir values for the rocks approached 12% (88% So).