Click on image for enlargement.
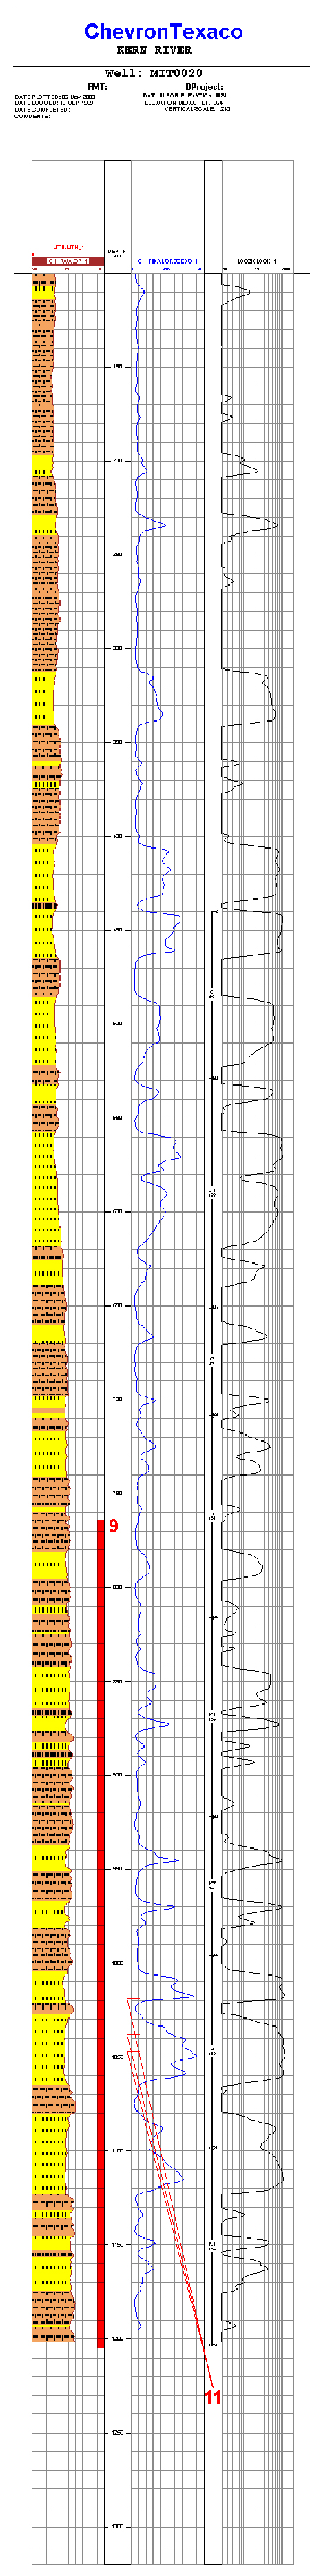
Figure 10. Lithologic and interpretive log suite of KRF reservoirs in MIT0020 (courtesy of Paul Harness, formation evaluation specialist). From left to right, the log shows the lithology (sandstone and siltstone), a resistivity curve, and a heat-corrected permeability curve based on the conductivity measurement. Interval in this well shown in Figure 9 is represented by a vertical column. Positions of samples used in thin-section, particle-size, and capillary-pressure analyses are also shown.