Click on desired image for enlargement.
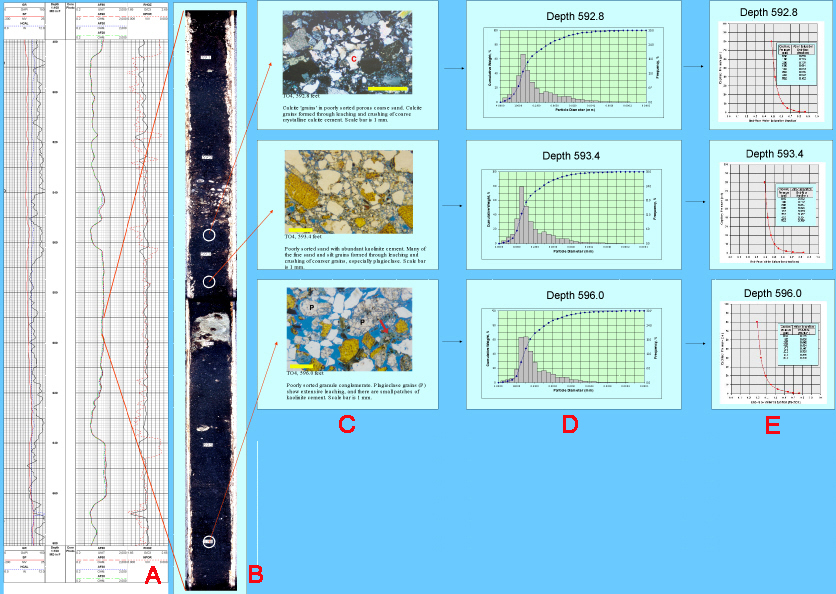
Figure 6. Well log (A), cored section (B), thin-sections (C), particle-size analysis (D), and capillary-pressure data (E) of KRF in TOL004-XTO. C.1. Calcite ‘grains’ in poorly sorted porous coarse sand. Calcite grains formed through leaching and crushing of coarse crystalline calcite cement. Scale bar is 1 mm. C.2. Poorly sorted sand with abundant kaolinite cement. Many of the fine sand and silt grains formed through leaching and crushing of coarser gains, especially plagioclase. Scale bar is 1 mm. C.3. Poorly sorted granule conglomerate. Plagioclase grains (P) show extensive leaching, and there are small patches of kaolinite cement. Scale bar is 1 mm. D. Laser particle-size analysis shows unimodal distributions with grain sizes ranging from granular to silt size. E. Overburden centrifuge capillary-pressure data show Swir values ranging from 48% to 29%.