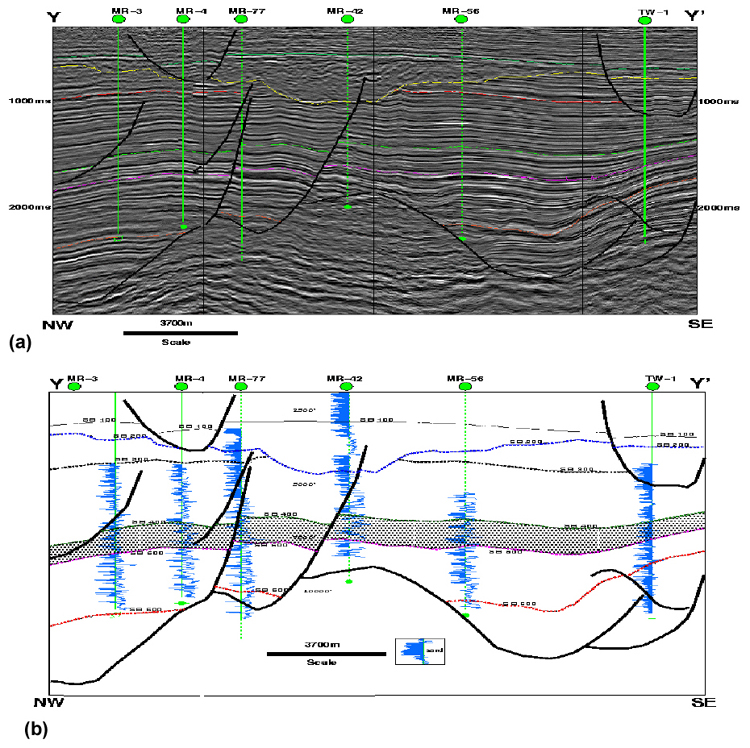
Figure 4. Longitudinal profile X-X’ through the study area. (a) Interpreted time seismic section. (b) Depth section showing faults, gamma-ray well logs and sequence boundaries.
Figure 4. Longitudinal profile X-X’ through the study area. (a) Interpreted time seismic section. (b) Depth section showing faults, gamma-ray well logs and sequence boundaries.