![]() Click to view article in PDF format.
Click to view article in PDF format.
Integrated Modeling of the Taratunich ![]() Field
Field![]() , Bay of Campeche,
Southern Mexico*
, Bay of Campeche,
Southern Mexico*
By
W.J. Clark1, F.O. Iwere1, O. Apaydin1, J. Moreno1, R. Leon Ventura2, R. Hernandez2, J. Garcia2, and F. Trevino3
Search and Discovery Article #20014 (2003)
*Adapted from “extended abstract” for presentation at the AAPG Annual Meeting, Salt Lake City, Utah, May 11-14, 2003.
1Schlumberger DCS, Greenwood Village, Colorado ([email protected])
2Pemex, Dos Bocas, Mexico
3Pemex, C. del Carmen, Mexico
Introduction
Taratunich ![]() Field
Field![]() is located about 80 km northwest of Ciudad del Carmen in the Bay of Campeche,
southern Mexico and is part of a series of prolific oil reservoirs that include
Cantarell and Abkatun-Pol-Chuc fields (Figure 1). Since its discovery in 1989,
the
is located about 80 km northwest of Ciudad del Carmen in the Bay of Campeche,
southern Mexico and is part of a series of prolific oil reservoirs that include
Cantarell and Abkatun-Pol-Chuc fields (Figure 1). Since its discovery in 1989,
the ![]() field
field![]() has produced over 150 MMSTB of oil from Jurassic and
Cretaceous/Paleocene carbonates. A multidisciplinary team consisting of
engineers, geologists, geophysicists and petrophysicists was assembled to
characterize and simulate the Taratunich
has produced over 150 MMSTB of oil from Jurassic and
Cretaceous/Paleocene carbonates. A multidisciplinary team consisting of
engineers, geologists, geophysicists and petrophysicists was assembled to
characterize and simulate the Taratunich ![]() Field
Field![]() with the objective of developing
a reservoir management plan that would increase daily production and ultimate
recovery. The following documents the methodologies used and the results from
this effort.
with the objective of developing
a reservoir management plan that would increase daily production and ultimate
recovery. The following documents the methodologies used and the results from
this effort.
|
|
Geology
The geologic structure of Taratunich A generalized stratigraphic column for the Bay of Campeche is shown in Figure 3. Production is from a thick (>750 m) Jurassic (Kimmeridgian) oolitic grainstone unit that has been dolomitized in part, and a thinner (60-120m) sedimentary gravity flow breccia and grainstone interval of Late Cretaceous to Paleocene age (‘‘Brecha’’ Formation). The diapir is interpreted to have completely penetrated the Kimmeridgian and at least part of the overlying Tithonian section. Movement of the salt probably took place during Late Jurassic and Early Cretaceous times. Thinning of the Tithonian through Paleocene sections toward the salt dome provides evidence of a paleotopographic high that formed as a response to synsedimentary salt movement. The Kimmeridgian section (JsK) consists of peloidal, oolitic, and pisolitic grainstones that were almost completely dolomitized on the western side of the salt swell (block 301). To the east (blocks 101 and 201), the JsK is comprised of tightly cemented limestones. The JsK was subdivided into 6 major shallowing-upward sequences bounded by maximum-flooding surfaces. In the upper reservoir intervals (where most log data were available), sequences were further subdivided into parasequence sets based on internal-flooding surfaces (Figure 3). Shale is more prominent in blocks 101 and 201 and served as the basis for defining the sequences in these areas. Dolomitization in block 301 was accompanied by dissolution of the original clasts and the development of round moldic pores. Moldic pores range from about 1mm to 5mm, are generally are not touching, and are connected by intercrystalline dolomite pores and microfractures. No moldic pores are present in the limestone.
The Tithonian consists of argillaceous and silty/sandy, deep-water
limestones. The Cretaceous section is pelagic lime mudstones with
grainstone and organic-rich beds in the Upper Cretaceous section. The ‘‘Brecha’’
interval (BPT-Ks: Figure 3) consists of coarse mud-matrix breccia facies
of debris-flow origin, channelized and non-channelized skeletal
grainstones interpreted as turbidite flows, and pelagic mudstones.
Debris for the gravity deposits was derived from the collapsing
carbonate platform to the east of Taratunich
Porosity
Three porosity types were identified in varying proportions in each
reservoir: matrix, vugs, and fractures. Routine core analysis, neutron
magnetic resonance (NMR), and capillary-pressure tests provided matrix
and vug porosity and permeability, and wireline logs provided matrix and
some portion of vug and fracture porosity. Oomoldic porosity in the JsK
was a challenge to quantify, and image-log
Fracture ModelingFractures occur throughout the entire stratigraphic interval, and enhance the permeability of the Kimmeridgian and ‘‘Brecha’’ reservoirs. However, in the Tithonian and most of the Cretaceous interval, matrix porosity is very low and fractures do not contribute to flow because of cementation and/or low fracture density. Software was used to balance the 3-D structure and to model fractures in the Kimmeridgian and ‘‘Brecha’’ intervals. This was accomplished by flattening at the tops of these two reservoirs and then restoring the flattened structure to its present day configuration. The fractures were then propagated with modeled strain analysis. The resulting fracture patterns were constrained using core, image log, and pressure data. Fractures generated by modeling were concentric around and radiating outward from the area of the salt piercement structure (Figure 4), fitting the patterns observed in the image logs. The fracture patterns and curvature analysis were used to develop a discrete fracture network (DFN), which was conditioned with well-test-analysis results and other engineering data.
Reservoir Engineering
Based on the analysis of the well and reservoir-performance data,
Analysis of the total porosity (matrix, fractures, and vugs) and sample-compressibility data showed that pore-volume compressibility increases as secondary porosity increases. This dependence, which is strong at low net stresses, gradually disappears as the reservoir pressure decreases or the net stress increases. Based on these results, pore-volume compressibility was generated for various effective and secondary porosity values that were used in the numerical flow models.
Numerical simulation flow models of the Taratunich
The flow models were calibrated against the
historical performance of every well. During the model calibration or
history matching process, the initial reservoir descriptions were
adjusted until the individual well and
Conclusions
Taratunich
ReferenceSantiago, Jose, and Alfonso Baro, 1992, Mexico’s giant fields, 1978-1988 decade, in Giant oil and gas fields of the decade 1978-1988: AAPG Memoir 54, p. 73-99. ________________ *1Mark of Schlumberger |
 Figure 1. Location of Taratunich
  Figure 2. Structure map at top ‘‘Brecha’’ (BPT-Ks).
Reservoir block numbers are shown in bold (e.g., block 101).
Figure 2. Structure map at top ‘‘Brecha’’ (BPT-Ks).
Reservoir block numbers are shown in bold (e.g., block 101).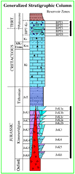 Figure 3. Generalized stratigraphic column for the Bay of Campeche area,
Mexico. Black bars indicate reservoir zones.
Figure 3. Generalized stratigraphic column for the Bay of Campeche area,
Mexico. Black bars indicate reservoir zones. Figure 4. Fracture pattern generated at the top Kimmeridgian reservoir
by modeling.
Figure 4. Fracture pattern generated at the top Kimmeridgian reservoir
by modeling.  Figure 5. Oblique view toward the north of Taratunich