|
Figure Captions
 Figure 1. Location of Taratunich Field on map
of main tectonic features of Bay of Campeche area (after Santiago and
Baro, 1992). Figure 1. Location of Taratunich Field on map
of main tectonic features of Bay of Campeche area (after Santiago and
Baro, 1992).
 Figure 2. Structure map at top ‘‘Brecha’’ (BPT-Ks). Figure 2. Structure map at top ‘‘Brecha’’ (BPT-Ks).
 Reservoir Reservoir block numbers are shown in bold (e.g., block 101).
Well paths
are shown as black lines. The salt does not penetrate up to this level
and is present below block 401 as a piercement structure confined
approximately by the faults. Salt is present under the entire area and
influenced sedimentation as well as the present structural configuration
of the field. block numbers are shown in bold (e.g., block 101).
Well paths
are shown as black lines. The salt does not penetrate up to this level
and is present below block 401 as a piercement structure confined
approximately by the faults. Salt is present under the entire area and
influenced sedimentation as well as the present structural configuration
of the field.
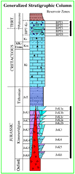 Figure 3. Generalized stratigraphic column for the Bay of Campeche area,
Mexico. Black bars indicate reservoir zones. Figure 3. Generalized stratigraphic column for the Bay of Campeche area,
Mexico. Black bars indicate reservoir zones.
 Figure 4. Fracture pattern generated at the top Kimmeridgian reservoir
by modeling. Figure 4. Fracture pattern generated at the top Kimmeridgian reservoir
by modeling.
 Figure 5. Oblique view toward the north of Taratunich Field JsK
formation simulation grid, showing depth ranging from approximately
10000 feet subsea (dark blue) to 16000 feet subsea (red). Figure 5. Oblique view toward the north of Taratunich Field JsK
formation simulation grid, showing depth ranging from approximately
10000 feet subsea (dark blue) to 16000 feet subsea (red).
The geologic structure of Taratunich field is a doubly plunging, WNW-ESE
aligned, reverse-faulted antiform with a salt piercement diapir/swell at
the center of the structure (Figure 2), as mapped from a 3-D seismic
survey and verified by well data. Two normal faults are present over the
area of the salt piercement structure and are oriented nearly
perpendicular to the reverse faults, creating a small graben over the
salt dome. No wells exist in the block to verify the seismic
correlations. The field is divided into separate compartments by the
faults, which are designated blocks 101-401 (Figure 2). Two wells have
crossed the southern reverse fault(s), but there is no oil production
from the areas south of the main field. There is, however, oil
production from block 101, north of block 201 and the northern reverse
fault. No wells penetrate the faulted compartment north of block 301 as
water is expected in this block because of the lower structural position
NW of block 101.
A generalized stratigraphic column for the Bay of Campeche is shown in
Figure 3. Production is from a thick (>750 m) Jurassic (Kimmeridgian)
oolitic grainstone unit that has been dolomitized in part, and a thinner
(60-120m) sedimentary gravity flow breccia and grainstone interval of
Late Cretaceous to Paleocene age (‘‘Brecha’’ Formation). The diapir is
interpreted to have completely penetrated the Kimmeridgian and at least
part of the overlying Tithonian section. Movement of the salt probably
took place during Late Jurassic and Early Cretaceous times. Thinning of
the Tithonian through Paleocene sections toward the salt dome provides
evidence of a paleotopographic high that formed as a response to
synsedimentary salt movement.
The Kimmeridgian section (JsK) consists of peloidal, oolitic, and
pisolitic grainstones that were almost completely dolomitized on the
western side of the salt swell (block 301). To the east (blocks 101 and
201), the JsK is comprised of tightly cemented limestones. The JsK was
subdivided into 6 major shallowing-upward sequences bounded by
maximum-flooding surfaces. In the upper reservoir intervals (where most
log data were available), sequences were further subdivided into
parasequence sets based on internal-flooding surfaces (Figure 3). Shale
is more prominent in blocks 101 and 201 and served as the basis for
defining the sequences in these areas. Dolomitization in block 301 was
accompanied by dissolution of the original clasts and the development of
round moldic pores. Moldic pores range from about 1mm to 5mm, are
generally are not touching, and are connected by intercrystalline
dolomite pores and microfractures. No moldic pores are present in the
limestone.
The Tithonian consists of argillaceous and silty/sandy, deep-water
limestones. The Cretaceous section is pelagic lime mudstones with
grainstone and organic-rich beds in the Upper Cretaceous section. The ‘‘Brecha’’
interval (BPT-Ks: Figure 3) consists of coarse mud-matrix breccia facies
of debris-flow origin, channelized and non-channelized skeletal
grainstones interpreted as turbidite flows, and pelagic mudstones.
Debris for the gravity deposits was derived from the collapsing
carbonate platform to the east of Taratunich field in the Yucatan area.
Three porosity types were identified in varying proportions in each
reservoir: matrix, vugs, and fractures. Routine core analysis, neutron
magnetic resonance (NMR), and capillary-pressure tests provided matrix
and vug porosity and permeability, and wireline logs provided matrix and
some portion of vug and fracture porosity. Oomoldic porosity in the JsK
was a challenge to quantify, and image-log techniques were used to
estimate this porosity. The reservoir model was prepared for dual
porosity flow simulation by combining matrix and non-connected vugs into
one component and fractures and connected vugs into the other component.
Property maps including all porosity types, thickness, net, and
log-derived permeability were prepared for each reservoir layer,
upscaled and input into the reservoir simulator.
Fractures occur throughout the entire stratigraphic interval, and
enhance the permeability of the Kimmeridgian and ‘‘Brecha’’ reservoirs.
However, in the Tithonian and most of the Cretaceous interval, matrix
porosity is very low and fractures do not contribute to flow because of
cementation and/or low fracture density. Software was used to balance
the 3-D structure and to model fractures in the Kimmeridgian and ‘‘Brecha’’
intervals. This was accomplished by flattening at the tops of these two
reservoirs and then restoring the flattened structure to its present day
configuration. The fractures were then propagated with modeled strain
analysis. The resulting fracture patterns were constrained using core,
image log, and pressure data. Fractures generated by modeling were
concentric around and radiating outward from the area of the salt
piercement structure (Figure 4), fitting the patterns observed in the
image logs. The fracture patterns and curvature analysis were used to
develop a discrete fracture network (DFN), which was conditioned with
well-test-analysis results and other engineering data.
Reservoir Engineering
Based on the analysis of the well and reservoir-performance data,
special laboratory fluid and core studies were designed and conducted in
an attempt to understand the problem of asphaltene precipitation, which
is a major problem in this field. Subsurface oil samples were collected
for use in the laboratory tests to determine the composition, phase
behavior, and onset pressures of asphaltene and wax precipitation and
its effects on fluid flow. The fluid-analysis tests showed asphaltene
precipitation within a range of reservoir pressure, and flow tests
revealed that the effective permeability of the rock decreases as
reservoir pressure declines and asphaltene precipitation occurs. The
changes were modeled with the Eclipse*1 reservoir
simulator.
Analysis of the total porosity (matrix, fractures, and vugs) and
sample-compressibility data showed that pore-volume compressibility
increases as secondary porosity increases. This dependence, which is
strong at low net stresses, gradually disappears as the reservoir
pressure decreases or the net stress increases. Based on these results,
pore-volume compressibility was generated for various effective and
secondary porosity values that were used in the numerical flow models.
Numerical simulation flow models of the Taratunich field were
constructed to capture the essential features of the BPT-Ks and JsK
reservoirs from the static model and the flow properties discussed
above. The major structural and fault trends, reservoir heterogeneity,
drilled and possible infill well locations, the locations of their
completion intervals and past, present, and anticipated producing
mechanisms of the reservoirs, and development strategies, such as water
and gas injection, were considered in the design of the grid system
(Figure 5) and flow models. The cells of the grid system were seeded
with properties from the static model and reservoir- and
production-engineering analyses.
The flow models were calibrated against the
historical performance of every well. During the model calibration or
history matching process, the initial reservoir descriptions were
adjusted until the individual well and field performance were closely
matched. Generally, the fracture-pore volume, permeability and sigma
factors (matrix to fracture transfer coefficient) were modified to match
the observed performance. Communication between wells in the respective
blocks also was adjusted using transmissibility barriers, such as faults
or change in rock flow properties. Based on the results of the
flow-model calibration and production forecast, infill wells were
proposed; new log suites and special core tests were recommended. Some
of these recommendations have already been implemented in the field.
Taratunich field is a complex and
heterogeneous carbonate reservoir that presented a challenge for
adequately modeling. The main problem was to represent realistically the
triple porosity system in a manner consistent with the geology and
transforming it into a dual porosity numerical model. The calibrated
model was used to predict field performance and guide economic
decisions. Our integrated team approach was very effective in modeling and simulating Taratunich Field.
Santiago, Jose, and Alfonso Baro, 1992,
Mexico’s giant fields, 1978-1988 decade, in Giant oil and gas fields of
the decade 1978-1988: AAPG Memoir 54, p. 73-99.
________________
*1Mark
of Schlumberger
Return
to top.
|